Deming regression (also called errors-in-variables regression) is a total regression method that fits a regression line when the measurements of both the explanatory variable (X) and the response variable (Y) are assumed to be subject to normally distributed errors. Recall that in ordinary least squares regression, the explanatory variable (X) is assumed to be measured without error. Deming regression is explained in a Wikipedia article and in a paper by K. Linnet (1993).
A situation in which both X and Y are measured with errors arises when comparing measurements from different instruments or medical devices. For example, suppose a lab test measures the amount of some substance in a patient's blood. If you want to monitor this substance at regular intervals (for example, hourly), it is expensive, painful, and inconvenient to take the patient's blood multiple times. If someone invents a medical device that goes on the patient's finger and measures the substance indirectly (perhaps by measuring an electrical property such as bioimpedance), then that device would be an improved way to monitor the patient. However, as explained in Deal, Pate, and El Rouby (2009), the FDA would first need to approve the device and determine that it measures the response as accurately as the existing lab test. The FDA encourages the use of Deming regression for method-comparison studies.
Deming regression in SAS
There are several ways to compute a Deming Regression in SAS. The SAS FASTats site suggests maximum likelihood estimation (MLE) by using PROC OPTMODEL, PROC IML, or PROC NLMIXED. However, you can solve the MLE equations explicitly to obtain an explicit formula for the regression estimates. Deal, Pate, and El Rouby (2009) present a rather complicated macro, whereas Njoya and Hemyari (2017) use simple SQL statements. Both authors also provide SAS code for estimating the variance of the Deming regression estimates, either by using the jackknife method or by using the bootstrap. However, the resampling schemes in both papers are inefficient because they use a macro loop to perform the jackknife or bootstrap.
The following SAS DATA Step defines pairs of hypothetical measurements for 65 patients, each of whom received the standard lab test (measured in micrograms per deciliter) and the new noninvasive device (measured in kiloohms):
data BloodTest; label x="micrograms per deciliter" y="kiloOhms"; input x y @@; datalines; 169.0 45.5 130.8 33.4 109.0 23.8 94.1 19.8 86.3 20.4 78.4 18.7 76.1 16.1 72.2 16.7 70.0 11.9 69.8 14.6 69.5 10.6 68.7 12.7 67.3 16.9 174.7 57.8 137.9 39.0 114.6 30.4 99.8 21.1 90.1 21.7 85.1 25.2 80.7 20.6 78.1 19.3 77.8 20.9 76.0 18.2 77.8 18.3 74.2 15.7 73.1 13.9 182.5 55.5 144.0 38.7 123.8 35.1 107.6 30.6 96.9 25.7 92.8 19.2 87.2 22.4 86.3 18.4 84.4 20.7 83.7 20.6 83.3 20.0 83.9 18.8 82.7 21.8 160.8 49.9 122.7 32.2 102.6 19.2 86.6 14.7 76.1 16.6 69.6 18.8 66.7 7.4 64.4 8.2 63.0 15.5 61.7 13.7 61.2 9.2 62.4 12.0 58.4 15.2 171.3 48.7 136.3 36.1 111.9 28.6 96.5 21.8 90.3 25.6 82.9 16.8 78.1 14.1 76.5 14.2 73.5 11.9 74.4 17.7 73.9 17.6 71.9 10.2 72.0 15.6 ; title "Deming Regression"; title2 "Gold Standard (X) vs New Method (Y)"; proc sgplot data=BloodTest noautolegend; scatter x=x y=y; lineparm x=0 y=-10.56415 slope=0.354463 / clip; /* Deming regression estimates */ xaxis grid label="Lab Test (micrograms per deciliter)"; yaxis grid label="New Device (kiloohms)"; run; |
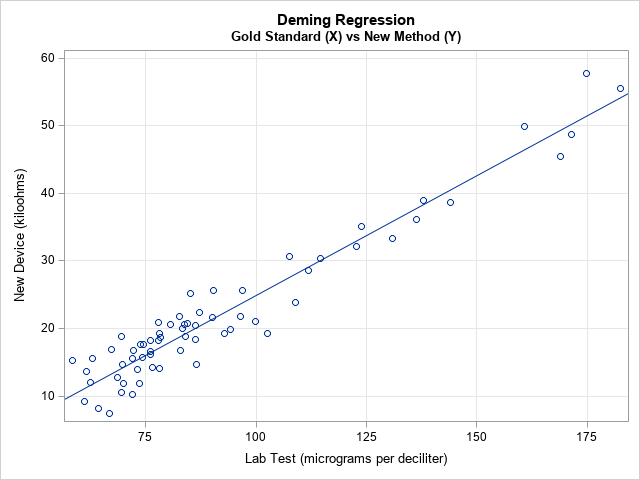
The scatter plot shows the pairs of measurements for each patient. The linear pattern indicates that the new device is well calibrated with the standard lab test over a range of clinical values. The diagonal line represents the Deming regression estimate, which enables you to convert one measurement into another. For example, a lab test that reads 100 micrograms per deciliter is expected to correspond to 25 kiloohms on the new device and vice versa. (If you want to convert the new readings into the old, you can regress X onto Y and plot X on the vertical axis.)
The following SAS/IML function implements the explicit formulas that compute the slope and intercept of the Deming regression line:
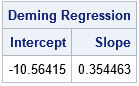
/* Deming Regression in SAS */ proc iml; start Deming(XY, lambda=); /* Equations from https://en.wikipedia.org/wiki/Deming_regression */ m = mean(XY); xMean = m[1]; yMean = m[2]; S = cov(XY); Sxx = S[1,1]; Sxy = S[1,2]; Syy = S[2,2]; /* if lambda is specified (eg, lambda=1), use it. Otherwise, estimate. */ if IsEmpty(lambda) then delta = Sxx / Syy; /* estimate of ratio of variance */ else delta = lambda; c = Syy - delta*Sxx; b1 = (c + sqrt(c**2 + 4*delta*Sxy**2)) / (2*Sxy); b0 = yMean - b1*xMean; return (b0 || b1); finish; /* Test the program on the blood test data */ use BloodTest; read all var {x y} into XY; close; b = Deming(XY); print b[c={'Intercept' 'Slope'} L="Deming Regression"]; |
The SAS/IML function can estimate the ratio of the variances of the X and Y variable. In the SAS macros by Deal, Pate, and El Rouby (2009) and Njoya and Hemyari (2017), the ratio is a parameter that is determined by the user. The examples in both papers use a ratio of 1, which assumes that the devices have an equal accuracy and use the same units of measurement. In the current example, the lab test and the electrical device use different units. The ratio of the variances for these hypothetical devices is about 7.4.
Standard errors of estimates
You might wonder how accurate the parameter estimates are. Linnet (1993) recommends using the jackknife method to answer that question. I have previously explained how to jackknife estimates in SAS/IML, and the following program is copied from that article:
/* Helper modules for jackknife estimates of standard error and CI for parameters: */ /* return the vector {1,2,...,i-1, i+1,...,n}, which excludes the scalar value i */ start SeqExclude(n,i); if i=1 then return 2:n; if i=n then return 1:n-1; return (1:i-1) || (i+1:n); finish; /* return the i_th jackknife sample for (n x p) matrix X */ start JackSamp(X,i); return X[ SeqExclude(nrow(X), i), ]; /* return data without i_th row */ finish; /* 1. Compute T = statistic on original data */ T = b; /* 2. Compute statistic on each leave-one-out jackknife sample */ n = nrow(XY); T_LOO = j(n,2,.); /* LOO = "Leave One Out" */ do i = 1 to n; J = JackSamp(XY,i); T_LOO[i,] = Deming(J); end; /* 3. compute mean of the LOO statistics */ T_Avg = mean( T_LOO ); /* 4. Compute jackknife estimates of standard error and CI */ stdErrJack = sqrt( (n-1)/n * (T_LOO - T_Avg)[##,] ); alpha = 0.05; tinv = quantile("T", 1-alpha/2, n-2); /* use df=n-2 b/c both x and y are estimated */ Lower = T - tinv#stdErrJack; Upper = T + tinv#stdErrJack; result = T` || T_Avg` || stdErrJack` || Lower` || Upper`; print result[c={"Estimate" "Mean Jackknife Estimate" "Std Error" "Lower 95% CL" "Upper 95% CL"} r={'Intercept' 'Slope'}]; |
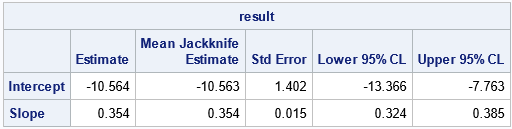
The formulas for the jackknife computation differs slightly from the SAS macro by Deal, Pate, and El Rouby (2009). Because both X and Y have errors, the t quantile must be computed by using n–2 degrees of freedom, not n–1.
If X and Y are measured on the same scale, then the methods are well-calibrated when the 95% confidence interval (CI) for the intercept includes 0 and the CI for the intercept includes 1. In this example, the devices use different scales. The Deming regression line enables you to convert from one measurement scale to the other; the small standard errors (narrow CIs) indicate that this conversion is accurate.
In summary, you can use a simple set of formulas to implement Deming regression in SAS. This article uses SAS/IML to implement the regression estimates and the jackknife estimate of the standard errors. You can also use the macros that are mentioned in the section "Deming regression in SAS," but the macros are less efficient, and you need to specify the ratio of the variances of the data vectors.

36 Comments
Great start to 2019, thanks Rick. As you wrote, we do lots of Deming regressions in the diagnostics world. Would love to see it incorporated into a PROC, but until then, good to have this IML approach.
I also often have colleagues who want to do a Passing-Bablok regression in SAS (https://en.wikipedia.org/wiki/Passing%E2%80%93Bablok_regression). Perhaps a potential topic for a future post. : )
OK. See my article on Passing-Bablock Regression in SAS.
Thank you for this post! Passing Bablok regression with bootstrapped confidence intervals for the estimates are also often needed in IVD...a future post would be much appreciated! :)
Hi Rick,
great post as always.
Looking at the Paper from Linnet of 1993 (Linnet K. Evaluation of Regression Procedures for Methods Comparison Studies. Clin Chem. 1993; 39(3): 424-4320 it looks as if there should be delta also in the denominator? So maybe the Wikipedia equation is not fully correct?
It's possible, but I would be surprised. I checked the formula by fitting data and comparing with other software. If the formula were incorrect, the slope of the regression line would not pass through the middle of the observed data.
I assume you are looking at the definition of b in the second column near the bottom of p. 430? I don't have my original notes, but I think I also looked at that equation. I think some cancellation occurs and the equation simplifies.
Considering that there are some differences in other terms that might be the most logical explanation, will try a comparison between the 2 formulas and see what happens, htanks for the reply!
Thanks Rick for a very helpful post. My question is this:
Since Deming regression assumes that there is a sampling error of both the x and y variable, how can the residuals from Deming regression be calculated? I want to know whether there is a systematic ascertainment bias on variable Z using method 1 vs. method 2 - but per Deming regression neither method 1 or 2 contains the "true" value of variable Z.
Great question. The 'systematic bias" is indicated by the intercept term of the Deming regression line. If the confidence intervals for the intercept excludes 0, you can conclude that there is systematic bias.
As you say, there are no residuals because you are not predicting the response from the data. The closest you can get to a residual plot is to plot the Gold Standard measurements (X) versus the difference in measurements (Y-X) between the new and old methods. This enables you to visually inspect the variance of the "residuals" and whether there is any systematic signal in the residuals.
Than you very much Dr Wicklin! You have saved my day
Kinds regards,
Leyla Depret-Bixio
Dear Rick Wicklin,
You estimate variances - according to the link below (page 8), Deming regression is under the assumption that variances are equal?
Carsten Enevoldsen
http://www2.agroparistech.fr/podcast/IMG/pdf/chimiometrie_2017_bivregbls_mberger-bgfrancq_final.pdf
No, that is not correct, and I didn't see any statement like that in the slideshow that you reference. An assumption of Deming regression is that the ratio of the variances is known. That is rarely true, but the ratio can be estimated.
Page 7 and 8 in the slides.
A quote: 'Can use DR as assumes λYX = constant and homogeneity on each axis'.
Estimation requires replicates?
Correct. lambda is the ratio of the variances (or standard deviations). If lambda=1, then the variances are equal. But you can use Deming regression when the ratio is not 1.
In your case data, you don't have replicates?
Pages 27-29 in slides
Carsten
Weighted or unweighted Deming regression should I use if the variable X and Y are measured with either constant error nor proportional error? It only measured with random error.
Thank for your kind reply
Isn't this just measurement error models? There has been a lot of books written on this topic.
Deming regression - confidence bands around regression line.
Dear Rick Wicklin,
Could you add statements to your IML code that give us confidence bands?
Thanks in advance
Carsten
The code includes confidence intervals for the Intercept and Slope parameters. If the X and Y measurements are on the same scale, you want to check whether the CI for the Intercept includes 0 and the CI for the slope includes 1.
A confidence band on the graph is most useful for traditional OLS regression, where X is measured independently and without error and is used to predict the response Y. That is not the case here because X and Y are measured in pairs and both contain measurement error. I have seen a confidence band on a plot of Deming regression, but how do you plan to use such a band? In Deming regression, you aren't using X to predict Y (or vice versa), you are testing to see whether the two measurements are linearly related over a range of values.
Thanks for prompt reply
In the paper here, the authors suggest to use a socalled Coverage Probablity Percent (CP%) to judge whether agreement between tests is 'satisfactory':
https://www.researchgate.net/publication/262385781_Choice_of_agreement_indices_for_assessing_and_improving_measurement_reproducibility_in_a_core_laboratory_setting
The essence of CP% is that the user should decide which deviation is practically relevant.
This is analogous to power-calculations where we in advance must decide which difference we want to detect.
For agreement-studies we could decide we could accept a certain difference from the identity line.
Now I could judge (visually) whether the confidence band of the Deming regression line is contained within the acceptable limits for the identity line along the entire range of data or parts..
Of course, I could also simply do some counting.
I know that I can test whether the regression slope is 1 with Proc Calis - output 30.9.4 here:
https://documentation.sas.com/?docsetId=statug&docsetTarget=statug_calis_examples20.htm&docsetVersion=15.1&locale=en
But I thought a confidence band is more intuitive
Hello Rick,
Thanks for this point on the relevance of confidence band on Deming regression. So, say, a 95%-Confidence interval estimate Y at X is not applicable in Deming regression.
In other words, confidence and or prediction interval estimates cannot be constructed (or hold true) with the Deming regression estimates, i.e.the RMSE?
I do not know how to construct a confidence band for Deming regression. Traditional bands are prediction intervals and are constructed from residuals. But there are no residuals in this computation because X and Y are measured together and both contain measurement error. I don't think a "prediction interval" makes sense because you aren't using X to predict Y or vice versa. You are testing to see whether the two measurements are linearly related over a range of values.
I think the confidence intervals for the parameters answer the scientific question, which is "are these measurements linearly equivalent?" When they are on the same scale, that means testing the hypotheses that Intercept=0 and Slope=1. I guess you could use bootstrapping to visualize the uncertainty in the regression line. You would sample with replacement many times and compute the regression line for each bootstrap resample. Then overly the semitransparent lines. It would look similar to my article on visualizing uncertainty in regression models. See the graph in the section "Simulate from the fitted model." But, to be honest, I'd rather view a scatter plot of the bootstrap estimates and overlay reference lines at (Intercept, Slope) = (0, 1). I think the scatter plot is more informative and less likely to be misinterpreted.
Thank you, Rick.
Martin, R (Clin Chem, 46:1, 100-104, 2000) has developed the confidence band for the Bias (Bc) of Y at Xc, Bc=a+Xc(b-1); CI=Bc +/- t(alpha/2, n-2).SE(Bc). I think this approach should be applicable to Yhat as well. It surprised me that df=n-2.
I haven't yet found literature for the prediction band either other than that in CLSI EP14.
CLSI EP14 does have a methodology for Deming prediction band, including an adjustment for the number of measurements associated with each (X, Y) pair.
This is important, in analytical method comparison studies, it is typical to call for 1+ measurements for each specimen in each method. EP9 calls for 2, EP14 for 2+.
Thanks Rick for a very informative post!
Perhaps it's delta = Syy / Sxx instead of delta = Sxx / Syy?
This is a correct comment.
Rick, would you mind to swap Sxx and Syy in the line of "delta = Sxx / Syy; /* estimate of ratio of variance */", and rerun the results, which should be:
Deming Regression
Intercept Slope
-11.72696 0.3670478
Thanks for pointing out the typo, delta should be Syy/Sxx indeed.
Brilliant exposition, Rick! Excellent compact use of SAS IML code for method comparison/correlation. In molecular diagnostics, we will typically will have the same scale (viz. log10) AND units on both X and Y and also include the bias plots (e.g. Bland-Altman). For this example, though technically possible, it would not seem kosher to do a bias plot as this would involve taking the difference of two measurements with different units. Right? Q. To remedy this, would you then want to compare "apples-to-apples" and standardize these to be unitless (e.g. Z-score) and redo the above so that we can now construct the bias plots (i.e. [x-y] vs. mean(x,y)] or [x-y] vs x)?
Thanks for writing. I haven't thought about your question before, but I think your suggestion is a good one. Standardizing variables is the usual way to deal with variables that are measured in different units.
Adding to the above, in molecular diagnostics (also Clinical Chemistry in general), we will compare typically have a conversion factor in converting to like-units on both measurements (e.g. copies of an analyte vs. international units (IU) per milliliter. In the example above, it would have to be a conversion between kiloohms and micrograms per deciliter and if such a thing does not make any sense whatsoever, then to employ the unit standardization (viz. Z-score) I mention in my previous post as the best alternative.
Rick,
The first column in Jackknife Estimate is different from Deming Regression ( b ).
Was it right ? and I run your code and got ( b ) .
Thanks for noticing. I have updated the table to match the code. The old table was the result of running b=Deming(XY, 1), which specifies the ratio of the variances instead of estimating the ratio from the data. If you flush your cache and reload, you will see the new table.
Hi Rick,
Could you update your IML for Weighted Deming?:
"Weighted Deming regression (Linnet, 1990) is a modification of Deming regression that assumes the ratio of the coefficient of variation (CV), rather than the ratio of variances, is constant across the measuring interval."
Thank you!
Thanks for the suggestion. I do not have access to that paper, and I am not planning to implement additional types of Deming regression.
Pingback: Passing-Bablok regression in SAS - The DO Loop
Great post!
The Njoya and Hemyari (2017) macro can reportedly accommodate repeated measures among the same subjects over time.
This 2022 paper incorporates your methods described in this post (https://www.lexjansen.com/pharmasug/2022/SA/PharmaSUG-2022-SA-004.pdf) and I am wondering if this macro can also accommodate repeated measures? To be clear, I’m not referring to replicates of the same sample, but rather the same participants measured at multiple time points.
Thank you!
No, my code does not support repeated measurements. With respect to Njoya and Hemyari, I don't think their code treats repeated measurements properly. They "handle" repeated measurements by using stratified sampling. This ensures that number of observations for each patient in the same for every bootstrap sample. So if Patient 1 has 10 observations, each bootstrap sample also has 10 obs for Patient 1. But if the measurements for Patient 1 were increasing (or decreasing) in the real data, that property is not preserved in the samples. A stratified sample merely preserves the number of observations, not any autocorrelation.