Did you add "learn something new" to your list of New Year's resolutions? Last week, I wrote about the most popular articles from The DO Loop in 2019. The most popular articles are about elementary topics in SAS programming or univariate statistics because those topics have broad appeal.
Advanced topics and multivariate statistics are less popular but no less important. If you want to learn something new, check out this "Editor's Choice" list of articles that will broaden your statistical knowledge and enhance your SAS programming skills. I've grouped the articles into three broad categories.
Regression statistics
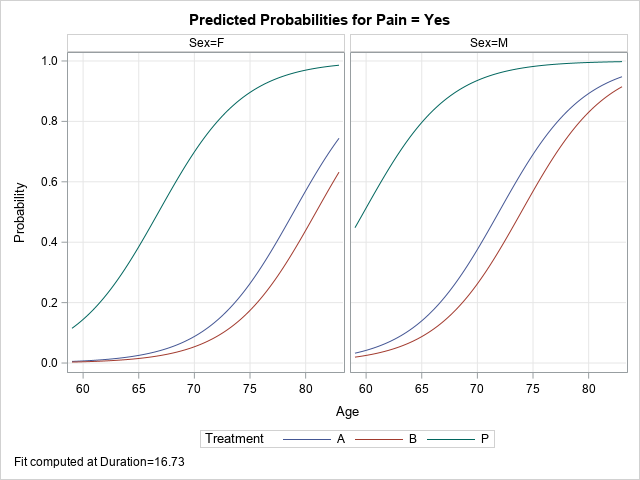
- Four reasons to use PROC PLM: PROC PLM is not as well known as it should be. You can use PROC PLM to perform postfit analyses on the model, including scoring new data, visualizing the model, hypothesis testing, and (re)displaying additional statistics.
- Deming regression: Deming regression is a method that fits a regression line when the measurements of both the explanatory variable (X) and the response variable (Y) are assumed to be subject to normally distributed errors. I explain what Deming regression is and how to implement Deming regression in SAS.
- Simulate linear regression data: Simulation is an essential topic in modern statistical analysis. This article shows how to simulate data that fits a linear regression model that has both continuous and categorical explanatory variables.
High-dimensional analyses and visualization:
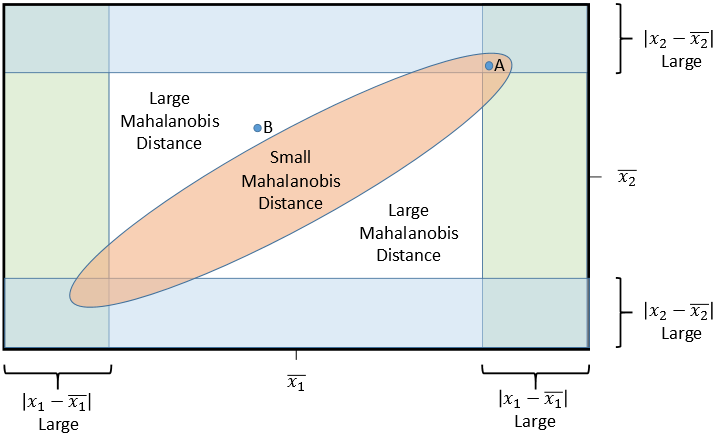
- The geometry of multivariate versus univariate outliers: For univariate data, an outlier is far from the center of the data. In higher dimensions, we need to account for correlations among variables when we measure distance. This article shows that an observation can be "far from the center" even if none of its individual coordinates are extreme.
- The cosine similarity of vectors: Cosine similarity is used in many machine learning models where you want to find observations or variables that are close to each other. This article explains what cosine similarity is and how to compute it in SAS.
- The basics of feature selection: Feature selection methods are ubiquitous in machine learning. It is important to understand the basics of feature selection in the simplest case, which is linear models. This article shows how to use options in the GLMSELECT procedure to perform feature selection and visualize the model-selection process.
- Create biplots in SAS: A principal component analysis sometimes enables you to visualize high-dimensional data by projecting the variables and observations onto a low-dimensional subspace. The resulting graph is called a biplot. You can learn how to interpret a biplot and how to create biplots in SAS.
Low-dimensional data visualization
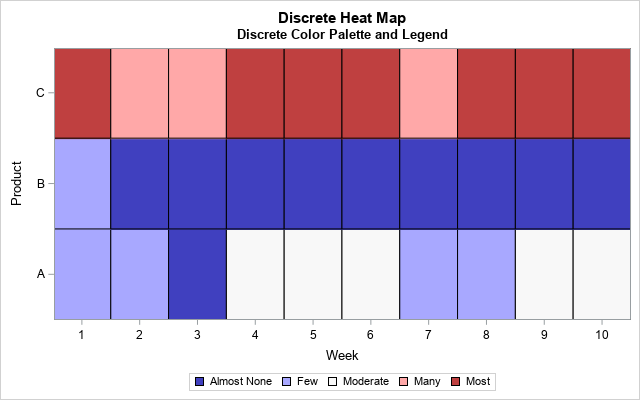
- Discrete heat maps: I use both discrete and continuous heat maps to visualize many kinds of data distributions. Learn how to use PROC SGPLOT to create a discrete heat map.
- Error bars for means: When you plot a mean at various time points or for various groups, there are multiple ways to indicate the variation in the data. You can plot the standard deviation of the data, the standard error of the mean, or a confidence interval for the mean. This article compares these three options.
- Guide to binning in SAS: Although binning is not strictly a data visualization technique, it can visualize the density of data and its extent. Check out "the essential guide to binning in SAS," which shows how to perform many kinds of univariate and bivariate binning.
The tips and techniques in these articles are useful, so read a few articles today and teach yourself something new in this New Year!
Do you have a favorite article from 2019 that did not make either list? Share it in a comment!

3 Comments
I appreciate and have used the cheat sheet about what encoding is used for CLASS variables in SAS regressions PROCs.
Hi Rick,
When PROC PLM is used for the EFFECTPLOT statement, after RESTORing the STOREd data set from PHREG, I get the message that the EFFECTPLOT statement cannot be used for the specified model.
Yes. The EFFECTPLOT statement is designed to visualize generalized linear models. I believe the procedures that EFFECTPLOT does not support are
LIFEREG, PHREG, RMSTREG, and SURVEYPHREG.
PROC LOGISTIC with a STRATA statement (conditional logistic regression).
The effect plot for the MIXED procedure only supports the fixed effects.
The RELIABILITY procedure in SAS/QC (but you can use the EFFECTPLOT statement in the procedure).
These are the ones I know about. I've asked the developer to add this list to the documentation for the EFFECTPLOT statement.