An important concept in multivariate statistical analysis is the Mahalanobis distance. The Mahalanobis distance provides a way to measure how far away an observation is from the center of a sample while accounting for correlations in the data. The Mahalanobis distance is a good way to detect outliers in multivariate normal data. It is better than looking at the univariate z-scores of each coordinate because a multivariate outlier does not necessarily have extreme coordinate values.
The geometry of multivariate outliers
In classical statistics, a univariate outlier is an observation that is far from the sample mean. (Modern statistics use robust statistics to determine outliers; the mean is not a robust statistic.) You might assume that an observation that is extreme in every coordinate is also a multivariate outlier, and that is often true. However, the converse is not true: when variables are correlated, you can have a multivariate outlier that is not extreme in any coordinate!
The following schematic diagram gives the geometry of multivariate normal data. The middle of the diagram represents the center of a bivariate sample.
- The orange elliptical region indicates a region that contains most of the observations. Because the variables are correlated, the ellipse is tilted relative to the coordinate axes.
- For observations inside the ellipse, their Mahalanobis distance to the sample mean is smaller than some cutoff value. For observations outside the ellipse, their Mahalanobis distance to the sample mean is larger than the cutoff.
- The green rectangle at the left and right indicate regions where the X1 coordinate is far from the X1 mean.
- The blue rectangle at the top and bottom indicate regions where the X2 coordinate is far from the X2 mean.
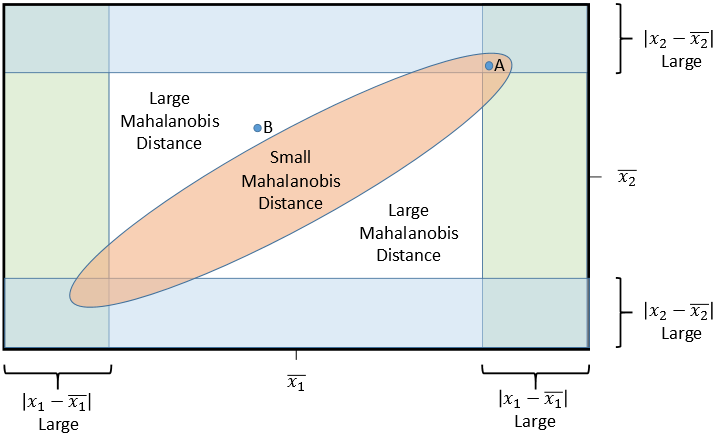
The diagram displays two observations, labeled "A" and "B":
- The observation "A" is inside the ellipse. Therefore, the Mahalanobis distance from "A" to the center is "small." Accordingly, "A" is not identified as a multivariate outlier. However, notice that "A" is a univariate outlier for both the X1 and X2 coordinates!
- The observation "B" is outside the ellipse. Therefore, the Mahalanobis distance from "B" to the center is relatively large. The observation is classified as a multivariate outlier. However, notice that "B" is not a univariate outlier for either the X1 or X2 coordinates; neither coordinate is far from its univariate mean.
The main point is this: An observation can be a multivariate outlier even though none of its coordinate values are extreme. It is the combination of values which makes an outlier unusual. In terms of Mahalanobis distance, the diagram illustrates that an observation "A" can have high univariate z scores but not have an extremely high Mahalanobis distance. Similarly, an observation "B" can have a higher Mahalanobis distance than "A" even though its z scores are relatively small.
Applications to real data
This article was motivated by a question from a SAS customer. In his data, one observation had a large Mahalanobis distance score but relatively small univariate z scores. Another observation had large z scores but a smaller Mahalanobis distance. He wondered how that was possible. His data contained four variables, but the following two-variable example illustrates his situation:
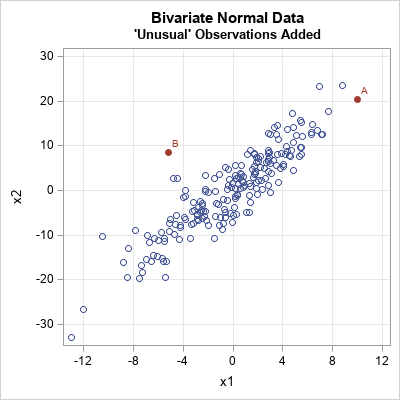
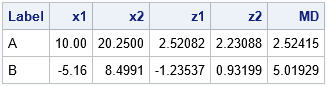
The blue markers were simulated from a bivariate normal distribution with μ = (0, 0) and covariance matrix Σ = {16 32.4, 32.4 81}. The red markers were added manually. The observation marked 'B' is a multivariate outlier. The Mahalanobis distance (MD) from 'B' to the center of the sample is about 5 units. (The center is approximately at (0,0).) In contrast, the observation marked 'A' is not a multivariate outlier even though it has extreme values for both coordinates. In fact, the MD from 'A' to the center of the sample is about 2.5, or approximately half the MD of 'B'. The coordinates (x1, x2), standardized coordinates (z1, z2), and MD for both points are shown below:
You can connect the Mahalanobis distance to the probability of a multivariate random normal variable. The squared MD for multivariate normal data is distributed according to a chi-square distribution. For bivariate normal data, the probability that an observation is within t MD units of the center is 1 - exp(-t2/2). Observations like 'A' are not highly unusual. Observations that have MD ≥ 2.5 occur in exp(-2) = 4.4% of random variates from the bivariate normal distribution. In contrast, observations like 'B' are extremely rare. Observations that have MD ≥ 5 occur with probability exp(-25/2) = 3.73E-6. Yes, if you measure in Euclidean distance, 'A' is farther from the center than 'B' is, but the correlation between the variables makes 'A' much more probable. The Mahalanobis distance incorporates the correlation into the calculation of "distance."
Summary and further reading
In summary, things are not always as they appear. For univariate data, an outlier is an extreme observation. It is far from the center of the data. In higher dimensions, we need to account for correlations among variables when we measure distance. The Mahalanobis distance does that, and the examples in this post show that an observation can be "far from the center" (as measured by the Mahalanobis distance) even if none of its individual coordinates are extreme.
The following articles provide more information about Mahalanobis distance and multivariate outliers:
- What is Mahalanobis distance?
- The Cholesky transformation and the geometry of multivariate normal variables
- The curse of dimensionality: How to define outliers in high-dimensional data?
- How to compute Mahalanobis distance in SAS
You can download the SAS program that generates the examples and images in this article.
