The Rise of Skywalker, the final movie in the third set of the three Star Wars trilogies, will finally be released tomorrow (December 20, 2019). That's 9 movies, in about 42 years. And, if the first movies aren't still fresh in your mind (or perhaps you weren't even born when they were released?), you might want to watch them all before watching the final one. But what order should you watch them in? ...
The tricky part is, they didn't release the movies in order of the episodes. The first movie they released was actually Episode 4 (see Release the fourth one first, they did). This way they could drop us right into the 'action' and get us hooked (and then later, release the earlier episodes to fill in the back-story). So now you need to decide whether you want to watch the movies in the order they were released, or in the order of the episodes.
Are you confused yet?!? 🙂 Well, I'm here to help! ... with a custom graphical timeline! I'm going to show you step-by-step how I created the timeline ... but if you're not interested in the programming details, then feel free to jump right to the Final Graph.
The Data
As with any graph, you first need to have the data. I went to Wikipedia, and found a table with all the release dates of the Star Wars films.
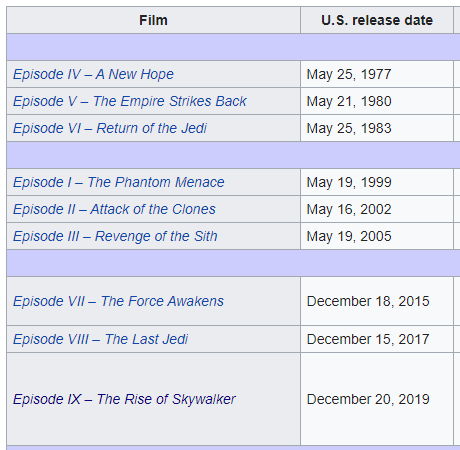
I input these values into a SAS table, using the following code, and then did a bit of text-parsing to get the episode number and title into separate variables.
data releases;
input release_date date9. title_info $ 11-80;
datalines;
25May1977 Star Wars: Episode IV - A New Hope
21may1980 Star Wars: Episode V - The Empire Strikes Back
25may1983 Star Wars: Episode VI - Return of the Jedi
19may1999 Star Wars: Episode I - The Phantom Menace
16may2002 Star Wars: Episode II - Attack of the Clones
19may2005 Star Wars: Episode III - Revenge of the Sith
18dec2015 Star Wars: Episode VII - The Force Awakens
15dec2017 Star Wars: Episode VIII - The Last Jedi
20dec2019 Star Wars: Episode IX - The Rise of Skywalker
;
run;
Preliminary Graphs
With a release date, episode number, and title, I have all the things I'll need for a basic scatter plot. Therefore that's where I started. Using the following minimal code, I "put the data to the paper"...
proc sgplot data=releases;
format release_date year4.;
scatter y=episode_num x=release_date / datalabel=title;
yaxis values=(1 to 9) grid gridattrs=(pattern=dot color=gray88);
xaxis grid gridattrs=(pattern=dot color=gray88);
run;
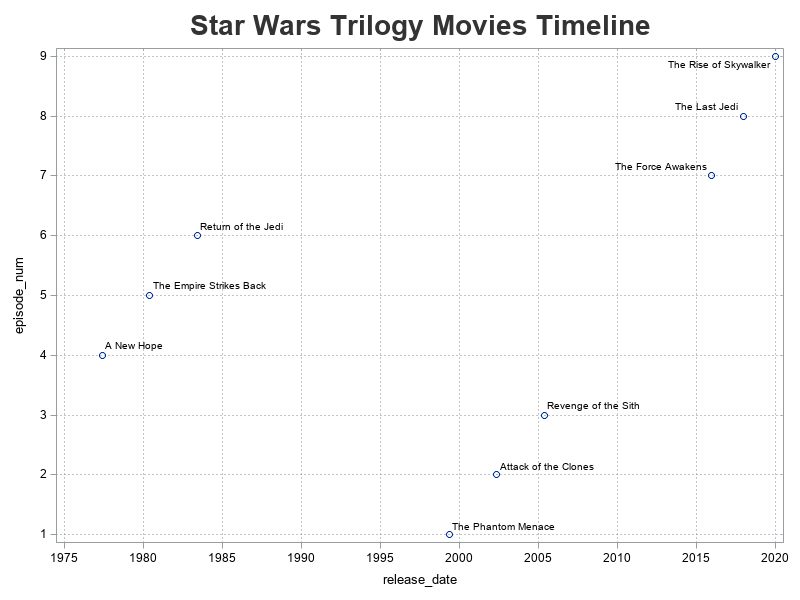
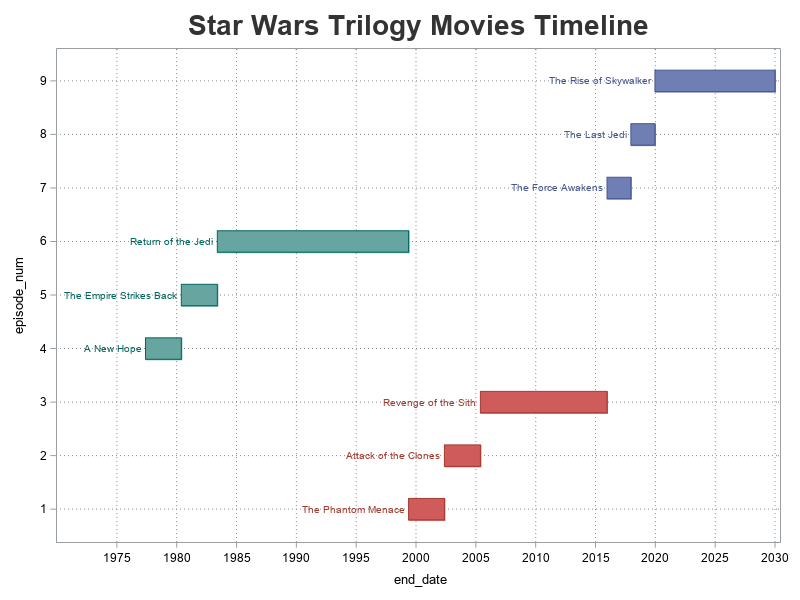
The above graph shows the release dates plotted against a proportional time axis, so it does give you some good insight into the data ... but it's just a bunch of individual points, and it doesn't really show the relationship between them. I want more of a timeline, rather than individual points. Therefore I enhanced the data a bit, and added an end_date for each movie (technically, that's a bit of a misnomer, because one movie didn't really "end" when the next movie started ... but sometimes you have to play data-games like that to get the visual effect you want). And now, with a start_date and end_date for each movie, I can get more of a timeline look, using a highlow plot.
proc sgplot data=releases noautolegend;
format end_date year4.;
highlow y=episode_num low=release_date high=end_date /
type=bar barwidth=.40 group=group_of_3 lowlabel=title;
yaxis values=(1 to 9) grid gridattrs=(pattern=dot color=gray88);
xaxis grid gridattrs=(pattern=dot color=gray88);
run;
Final Graph
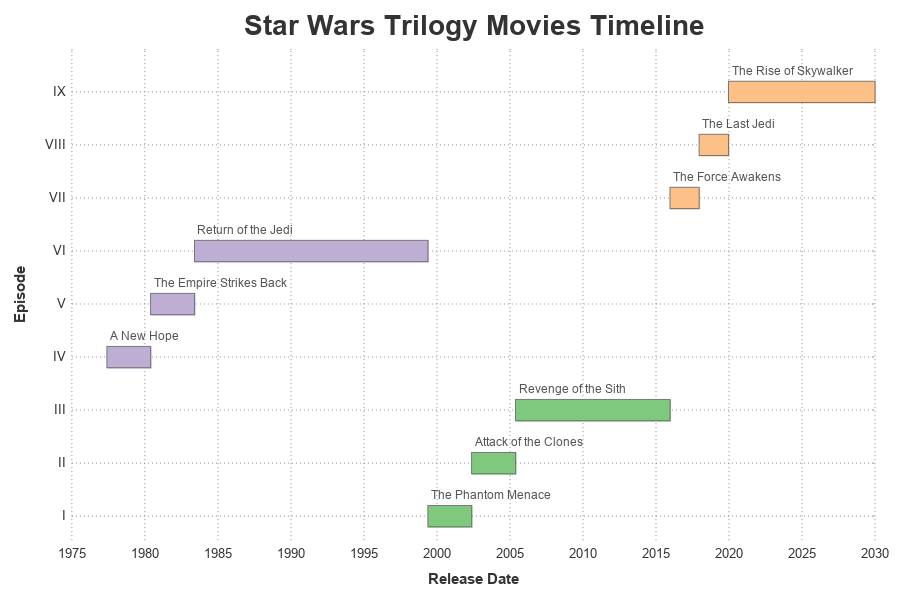
That graph looks more like a timeline, but it's still not quite what I had in mind. The highlow plot lets you easily add text to the left or right of the segments, but that takes up a lot of space with these long movie titles (and looks a little awkward). I wanted to put the titles above the segments ... but since there's no built-in option to do that in the highlow plot, I had to annotate them. Here's the code I used to create my annotate dataset:
data anno_labels; set releases;
length label $300 anchor x1space y1space function textcolor $50;
layer='front'; x1space='datavalue'; y1space='datavalue';
function='text'; textcolor='gray55'; textsize=9.5; textweight='normal';
width=100; widthunit='percent'; anchor='left';
label=trim(left(title));
x1=release_date; y1=episode_num+.4;
run;
I also customized my axes a little, specified some custom colors, and applied the roman5. numeric format to the episode numbers (click here to see the complete final code). And here's the final graph:
Bonus Footage
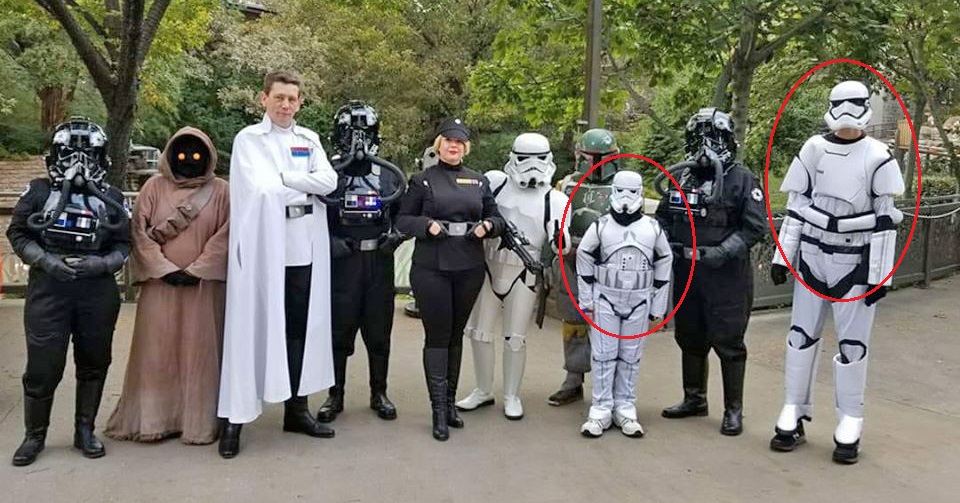
For those of you who made it all the way to the bottom, here's a little reward. This is a picture of my friend Regina's kids (Noah & Lindsay), dressed as storm troopers, ready to trick-or-treat at the Dallas Zoo. Quick quiz - how many different episodes are represented by the characters in this photo? (feel free to leave your guess in the comments)


10 Comments
Highlow charts are a useful technique to show time span and overlaps. For these movies, I would be more interested in seeing the time spans of the stories in fiction. We know these stories take place a long, long time ago -- but some are less long ago than others. The movies are vague on the timelines -- we have to infer based on the age of characters and events. But we know that characters age differently in this universe -- some of them are hundreds of years old, after all. And thanks to light speed and the theory of relativity, characters should age differently depending on where they are and where they are going to. I'm sure some Star Wars geeks have figured all of this out.
Chris - looking forward to seeing your upcoming graph for the time spans of the stories in fiction! 🙂
How about a graph/chart showing the locations in the universe where each episode takes place?
There are six different episodes represented by the characters in the photo.
Saw The Rise of Skywalker last night - epic.
And then there's the whole idea of the best viewing order!
https://www.mentalfloss.com/article/502011/best-order-to-watch-star-wars
I like the Machete order, but I'd miss Darth Maul!
Ahh! - Interesting article!
I still don't know the correct order...... 8-D
Of course, in reality, it might just be in whatever order Netflix sends you the DVDs! 🙂
(doh - I guess I'm showing my age, talking about DVDs!)
I'm one of the approximately 3 million people who still get the discs in the mail.
But now I do streaming as well.