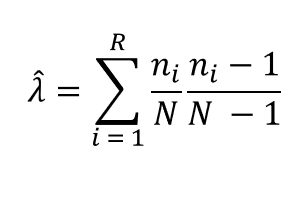
Visualize the Gini-Simpson diversity index

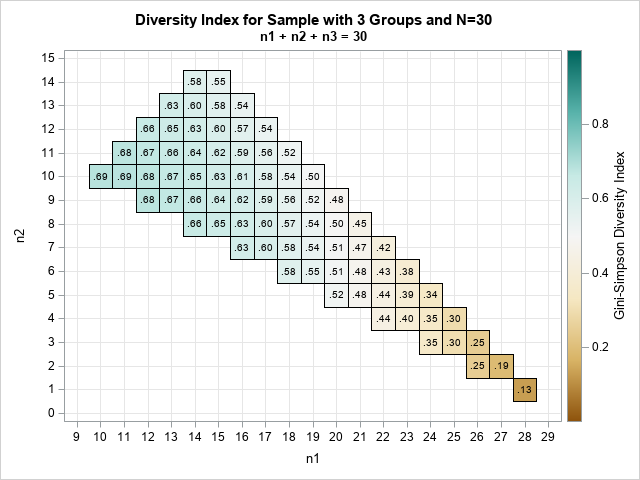
A previous article discusses the Gini-Simpson diversity index and how to compute it in SAS. Suppose you have a sample that contains R classes. (Classes are also called groups or categories.) Intuitively, the sample exhibits "high diversity" if the class sizes are approximately equal. The sample shows "low diversity" if