If you toss a coin 28 times, you would not be surprised to see three heads in a row, such as ...THHHTH.... But what about eight heads in a row? Would a sequence such as THHHHHHHHTH... be a rare event?
This question popped into my head last weekend as I attended my son's graduation ceremony. As the students marched in, I noticed that men were dressed in green cap and gowns, whereas the women were dressed in white. They entered in alphabetical order, which randomized the men and women. They filed into 12 rows that each contained 28 seats. Thus each row is like an independent toss of a coin, with green and white representing heads and tails, respectively.
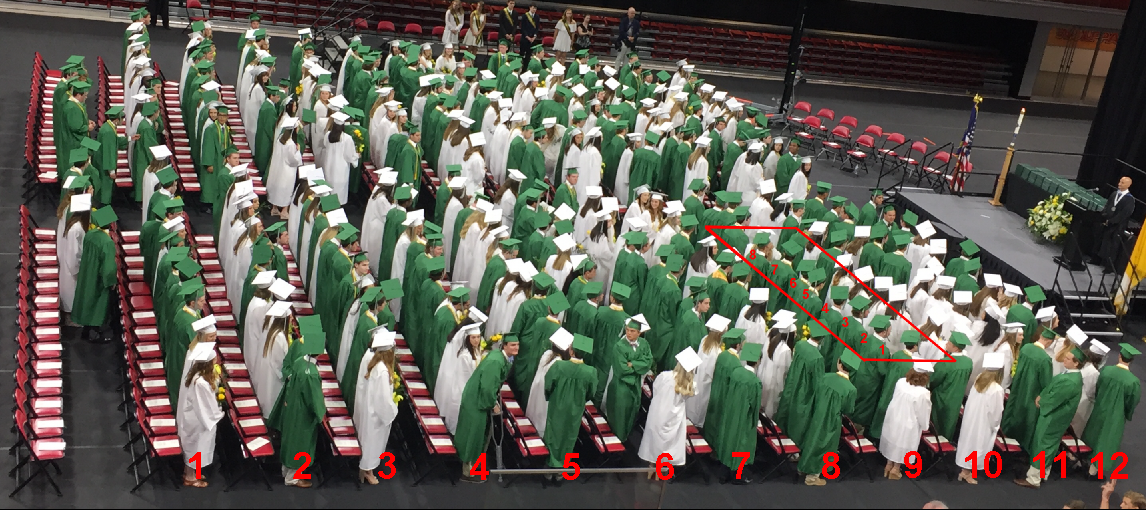
When the students entered the ninth row from the left (fourth from the right), I noticed a sequence of eight consecutive "little green men," which is highlighted in red in the picture on this page. (Click to enlarge.) I wish I had a photo of the students seated in their chairs because the effect is more dramatic when the green mortarboards are all aligned. But take my word for it: the long sequence of green was very noticeable.
The picture shows that there was actually a row to the extreme left that was partially filled. For the purpose of this article, ignore the partial row. In the 12 full rows, the number of men in each row is (from left to right) {15, 15, 14, 11, 16, 16, 15, 10, 20, 9, 14, 13}. Remarkably, this adds to 168, so the proportion of men is exactly 0.5 of the 12 x 28 = 336 students.
Simulate the binary pattern
You can simulate the students by generating 336 random binary values arranged on a 12 x 28 grid. Since this was the graduating class of 2017, I used 2017 as the random number seed in the following DATA step:
%let NumRows = 12; %let NumInRow= 28; data Graduation; call streaminit(2017); do row = 1 to &NumRows; do seat = 1 to &NumInRow; Male = rand("Bernoulli", 0.5); output; end; end; run; title "One Simulated Seating Arrangement"; proc sgplot data=Graduation; styleattrs wallcolor=grey DATACONTRASTCOLORS=(white green); scatter x=Row y=Seat / group=male markerattrs=(symbol=SquareFilled); xaxis integer values=(1 to 12); run; |
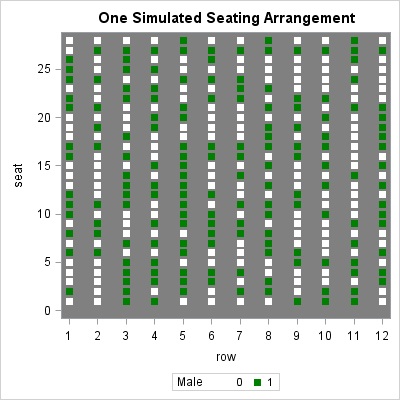
If you look at row 5 in the image, you will see a sequence of nine consecutive green markers. The fact that a simulated data set reproduced the graduation scenario on the very first attempt makes me think that this situation is not very rare. However, changing the seed a few times shows that the situation does not always occur.
Runs in coin tosses
There are 12 rows, each containing 28 students. The event of interest is a row with eight or more consecutive males. The easiest way to compute the probability of this happening is to first compute the probability for one row. Since the rows are assumed to be independent, you can then compute the probability of seeing the event in any of the 12 rows.
A sequence of consecutive events is also called a "run" of events. If you do an internet search for "probability of k heads in a row" or "probability of runs in coin toss", you will find many solutions to this problem. The source I used is a question that was asked on StackExchange about "blocks of events." Whereas many people approach this problem by using a simulation or an explicit recursive mathematical formula, "Neil G" and "COOLSerdash" compute the probability by using a Markov transition matrix, which is easy to create in the SAS/IML matrix language.
The following statements define a function that creates the Markov transition matrix and iterates it to compute the probability that coin will show k consecutive heads in N tosses. The program works for any probability of heads, not merely p=0.5. See the StackExchange article for the explanation:
proc iml; k = 8; * desired number of correct trials in a row; p = 1/2; * probability of getting a correct trial; N = 28; * Total number of trials; /* Iterate Markov transition matrix to compute probability of k consecutive heads in N tosses of a coin that has probability p of showing heads */ start ProbConsec(N, p, k); M = j(k+1, k+1, 0); * set up the transition matrix M; M[1, 1:k] = (1-p); * first row, except for last column; M[k+1, k+1] = 1; * lower right corner; do i = 2 to (k+1); M[i, i-1] = p; * subdiagonal elements; end; Mn = M**N; * Calculate M^N; /* Prob that starting in State 1 ends in State (k+1) */ return(Mn[(k+1), 1]); finish; prob = ProbConsec(N, p, k); print prob; |

The result shows that the probability of seeing 8 consecutive heads out of 28 tosses is 0.0426. This is the same probability as observing 8 consecutive men in green in one of the rows at graduation, assuming that alphabetical ordering randomizes men and women. However, remember that there were 12 rows at graduation, so the probability of observing this event in ANY row is higher, as shown below:
ProbSee0 = (1-prob)##12; * P(Not in Row1 AND ... NOT in Row 12); ProbSeeAny = 1 - ProbSee0; * P(In Row1 OR ... OR in Row 12); print ProbSeeAny ProbSee0; |
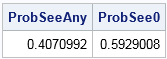
The chance of observing exactly eight consecutive men in any of the 12 rows is about 41%. Of course, you can also compute the probability of observing 9, 10, 11, or more consecutive men. When you add up the probabilities, you discover that the cumulative probability of observing an "extreme arrangement" of 8 or more consecutive men is about 0.64. And why stop there? You could extend this analysis to include a sequence of consecutive women!
Summary
In summary, graduation events can be long, but computing the probabilities of interesting arrangements of the students can help make the time go faster! I wasn't able to compute the probabilities in my head while at the graduation, but it didn't take long to research the problem and solve it with SAS after I got home. I conclude that observing a long sequence of men in a randomized seating arrangement that has 12 rows of 28 seats is not a rare event. In fact, the chance of observing a run of eight or more men is about 64%.
The real lesson for all of us is that we should keep our eyes open and look around. Math and statistics are everywhere!

12 Comments
Love how the patterns of the graduation gowns inspired the post. Great analysis and curiousity Rick. BTW, were the graduates seated in a particular order (surname)?
Kind Regards,
Michelle
Ahhhh I just re-read the post and saw it was alphabetical.... mmmm an analysis in itself that would be interesting ;-)
Hi, Rick
The WALLCOLOR option in the Styleattr statement for PROC SGPLOT has been in effect since SAS 9.4 M3, I wonder if there is another way to specify the WALL COLOR for a graph in SAS 9.4 M2 Prior.
Many Thanks!
Best regards,
Yajun
Yes. Graph attributes are defined by ODS styles. Create a style that overrides the 'graphwalls' attributes, as shown in this example.
Hi, Rick
Thanks for your reply. Your IML program gives a neat answer about the probability of consecutive head tosses, and I noticed that you formulate a Markov Matrix first, and I wonder what the starting status and ending status for this Markov Matrix. Could you please illustrate further about this? Thanks a lot.
Best,
Yajun
Yes. See the responses by "Neil G" and "COOLSerdash" in this StackExchange question.
It's really a wonderful and beautiful solution, thanks for your everyday posts.
Yes, sequences of heads/tails are very interesting. In Blink: The Power of Thinking Without Thinking, Malcolm Gladwell talks about a statistics professor who had half of her students flip a coin 50 or 100 times, then the other half make up their own results. She quickly identified which results were real and which were fake, stunning her students. Another great example of what you are illustrating.
Ah, the power of statistics! Those who don't believe Gladwell's story might enjoy reading the article "How to tell whether a sequence of heads and tails is random."
Congratulations to your son! My daughter graduates today, but her class distribution is different. I'll count later, but I'd guess it's nearly 3/4 young women, and only 44 students in this class.
Rick,
I would like to see you handle this question by data simulation.
BTW, I know this is a personal question. You might not want to answer.
Which college has your son been accepted? Cornell University?
%let NumRows = 1000000;
%let NumInRow= 28;
data Graduation;
array x{28} male1-male28;
call streaminit(123456789);
do row = 1 to &NumRows;
do seat = 1 to &NumInRow;
x{seat} = rand("Bernoulli", 0.5);
end;
if find(cats(of x{*}),'11111111') then found=1;
else found=0;
output;
end;
run;
proc means data=graduation mean;
var found;
run;
The StackExchange post has a simulation by whuber that is similar to what I would do in SAS/IML. The simulation would compute P(8 or more males) for a row of 28 students.