A frequently asked question on SAS discussion forums concerns randomly assigning units (often patients in a study) to various experimental groups so that each group has approximately the same number of units. This basic problem is easily solved in SAS by using PROC SURVEYSELECT or a DATA step program.
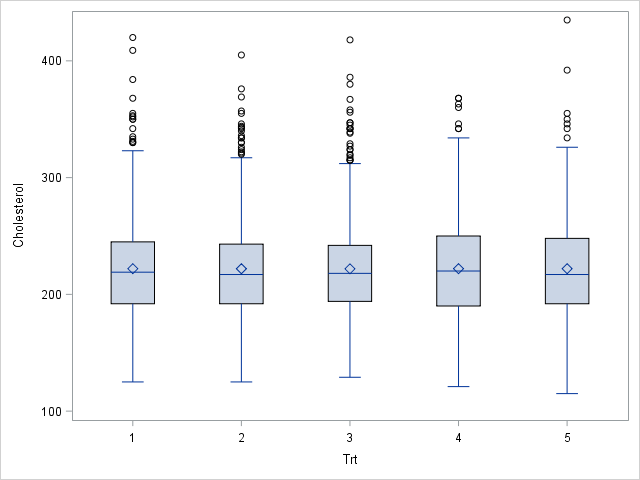
A more complex problem is when the researcher wants the distribution of a covariate to be approximately equal for each group. For example, a medical researcher might want each group of patients to have approximately the same mean and variance for their cholesterol levels, as shown in the plot to the right. This second problem is much harder because it involves distributing the units (non-randomly) so that the groups satisfy some objective. Conceptually, you want an assignment that minimizes the difference between moments (mean, variance, skewness,...) of the subgroups.
The OPTEX procedure for optimal design
Creating an experimental design that optimizes some criterion is one of the many uses of the OPTEX procedure in SAS/QC software In fact, this problem is one of the examples in the PROC OPTEX documentation. The example in this blog post follows the documentation example; see the documentation for details.
To solve this assignment problem with PROC OPTEX, you need to specify three things:
- A data set (call it UNITS) that contains the individual units (often patients) that you want to assign to the treatments. For this example, the units are the living patients in the Sashelp.Heart data set.
- A data set (call it TREATMENTS) that contains the names of the treatment groups. This example uses five groups with values 1, 2, 3, 4, and 5.
- The covariate in the problem. The OPTEX procedure will assign units to groups so that the first k moments are approximately equal across treatment groups. This example uses the Cholesterol variable and k=2, which means that the mean and variance of the cholesterol levels for patients in each treatment group will be approximately equal.
The following statements create the two data sets and define a macro variable that contains the name of the Cholesterol variable:
/* Split the living Sashelp.heart patients into five groups so that mean and variance of cholesterol is the same across groups. */ data Units; /* each row is a unit to be assigned */ set Sashelp.Heart(where=(status = "Alive")); keep Sex AgeAtStart Height Weight Diastolic Systolic MRW Cholesterol; run; %let NumGroups =5; /* number of treatment groups */ data Treatments; do Trt = 1 to &NumGroups; /* Trt is variable that assigns patients to groups */ output; end; run; %let Var = Cholesterol; /* name of covariate */ |
As discussed in the PROC OPTEX documentation, the following call creates an output data set (named GROUPS) that assigns each patient to a group (1–5). A call to PROC MEANS displays the mean and variance of each group.
proc optex data=Treatments seed=97531 coding=orthcan; class Trt; model Trt; /* specify treatment model */ blocks design=Units; /* specify units */ model &Var &Var*&Var; /* fixed covariates: &Var--> mean, &Var*&Var--> variance */ output out=Groups; /* merged data: units assigned to groups */ run; proc means data=Groups mean std; class Trt; var &Var; run; |
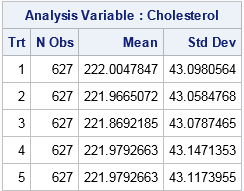
Success! The table shows that each group has approximately the same size and approximately the same mean and variance of the Cholesterol variable. Remember, though, that this assignment scheme is not random, so be careful not to make unjustified inferences from estimates based on these group assignments.
I am not an expert on experimental design, but a knowledgeable colleague tells me that optimal design theory states that the design that minimizes the variance of the treatment effects (adjusting for the first two moments of the covariate) is the design in which treatment means and variances of the covariate are as equal as possible. This is the design that PROC OPTEX has produced.
The following call to PROC SGPLOT uses box plots to visualize the distribution of the Cholesterol variable across treatment groups. The graph is shown at the top of this article. Clearly the distribution of cholesterol is very similar for each group.
proc sgplot data=Groups; vbox &Var / category=Trt; run; |
In summary, the OPTEX procedure in SAS/QC software enables you to assign units to groups, where each group has approximately the same distribution of a specified covariate. In this article, the covariate measured cholesterol levels in patients, but you can also group individuals according to income, scholastic aptitude, and so on. For large data sets, the assignment problem is a challenging optimization problem, but PROC OPTEX provides a concise syntax and solves this problem efficiently.

15 Comments
Very interesting question. I would try Genetic Algorithm .
And I think SAS/OR also could solve such kind of question.
@Rob might try it .
I had the same thought about using genetic algorithms in SAS/IML. It seems likely that you could modify the "knapsack problem" example in the SAS/IML documentation.
Rick,
Yeah. But GA can not guarantee you to get the optimal solution.
That is the reason why I call @RobPratt in the first place.
I also want know whether OR could solve this problem
when the dataset has one million obs .
I think he and I already answered that question: there is no simple built-in method for solving this problem in SAS 9.4.
very depressed .
Rick,
What happen if using more than one variable other than one to split the data given the sample size is large enough?
Great question! PROC OPTEX supports multiple variables. For example, if you want the groups to have patients that have the same average diastolic and systolic blood pressures, you can write:
Rick,
The following code should look right and get the similar result as yours.
Analysis Variable : Cholesterol
COL_MEM N Obs Mean Std Dev
1 630 221.9544715 43.0901775
2 662 221.9627907 43.1227683
3 629 221.9457237 43.0978582
4 648 221.9667722 43.0939030
5 649 221.9685039 43.0944852
Nice. I was going to look at using GA to solve this problem, but you beat me to it. Thanks for posting your solution.
Nice.
I've managed to run KSHARP's GA code with 2 variables. The code is attached below.
I think it's cleaner to apply the ## operator (elementwise power operator) to the objective function to be minimized (SSE in KSHARP's code).
I wonder which command in the GA setup forces the group split to be relatively equal in size of the number of observations. Thanks in advance for the answer.
proc iml;
use units nobs nobs;
read all var {Cholesterol AgeAtStart};
close;
start function(x) global(Cholesterol, AgeAtStart, nobs, group, mean_std);
if countunique(x)=group then do;
do i=1 to group;
idx=loc(x=i);
temp=AgeAtStart[idx];
mean_std[i,1]=mean(temp);
mean_std[i,2]=std(temp);
temp1=Cholesterol[idx];
mean_std[i,3]=mean(temp1);
mean_std[i,4]=std(temp1);
end;
sse=sum((mean_std[,]-mean_std[><,])##2) ;
end;
else sse=999999;
return (sse);
finish;
group=5; /* <--Change it(divide into 5 groups)*/
mean_std=repeat(j(group,2,.),1,2);
/*print mean_std;*/
encoding=j(2,nobs,1);
encoding[2,]=group;
id=gasetup(2,nobs,123456789);
call gasetobj(id,0,"function");
call gasetsel(id,10,1,1);
call gainit(id,100,encoding);
niter = 50;
do i = 1 to niter;
call garegen(id);
call gagetval(value, id);
end;
call gagetmem(mem, value, id, 1);
col_mem=t(mem);
create group var {col_mem};
append;
close;
print value[l = "Min Value:"] ;
call gaend(id);
quit;
data want;
merge group units(keep=AgeAtStart Cholesterol);
run;
proc means data=want mean std;
class col_mem;
var AgeAtStart Cholesterol;
run;
Arne ,
You can use special encoding (fixed-length sequence) and SHAPE() function.
I noticed there are some missing value in Cholesterol ,so I fixed it again and looks like better than your result.
OUTPUT:
The MEANS Procedure
Analysis Variable : Cholesterol
group N Obs Mean Std Dev
1 627 221.9649123 43.1137738
2 627 221.9665072 43.1220553
3 627 221.9505582 43.0823468
4 627 221.9569378 43.0712286
5 627 221.9601276 43.1105645
Rick,
I don't know why my code
sum(mean_std[ ,]-mean_std[><,]);
Rick,
It seems blog eat " " .
original code
sum(mean_std[ ,]-mean_std[><,]);
should be
sum(mean_std[ ,]-mean_std[><,]);
sum(mean_std[ < > ,]-mean_std[><,]);
In HTML, the < and > signs delimit an HTML directive.
When you post code, it is best to put it inside a PRE block:
< pre lang="sas" escaped="true" >
code here
< \pre >