Last week I wrote about the 10 most popular articles from The DO Loop in 2016. The popular articles tend to be about elementary topics that appeal to a wide range of SAS programmers. Today I present an "editor's choice" list of technical articles that describe more advanced statistical methods in SAS.
I've grouped the articles into three categories: statistical graphics and visualization, statistical computations, and matrix computations. If you are a SAS statistical programmer, these articles deserve a second look.
Ten posts from The DO Loop that deserve a second look #SASTip Share on XStatistical graphics and visualization
SAS ODS graphics provides an easy way to create standard graphs for data analysis. The graphs in this list are more sophisticated:
- Have you ever struggled to specify the order and colors of categorical variables? This article provides a general technique that is often useful: insert special observations at the top of the data before you create the graph. A related technique is to append observations at the bottom of the data so that you can visually represent special values in a graph.
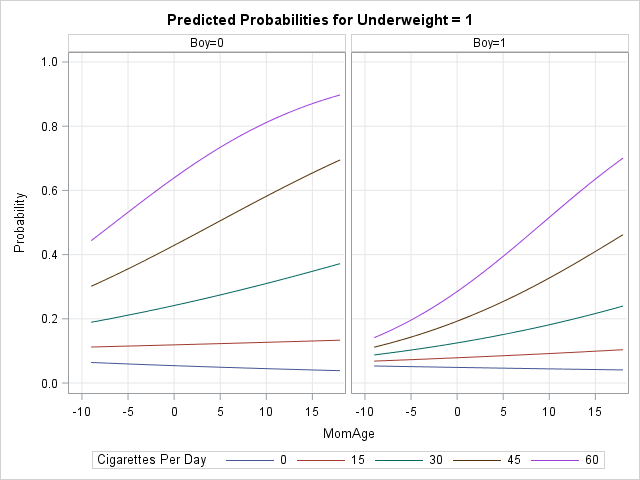
- If you want to visualize complex regression models in SAS, you MUST learn about the EFFECTPLOT statement! An effect plot shows the predicted response as a function of certain covariates while other covariates are held constant.
- For time-varying processes and iterative methods, animation is a valuable visualization technique. Learn how to create an animated GIF is SAS by using the BY statement in PROC SGPLOT.
Statistical computations
These article show helpful statistical techniques that you should know about:
- Confidence intervals are an essential tool in inferential statistics. This article uses simulation to answer the question "What are confidence intervals?" A related post shows how to compute confidence intervals for a multivariate mean.
- Most SAS procedures include a CLASS statement for handling the analysis of discrete classification variables. However, for some advanced statistical methods, you might need to generate a design matrix, which is a set of variables that represent categorical variables and interactions in a regression model. This article describes four SAS procedures that can generate a design matrix.
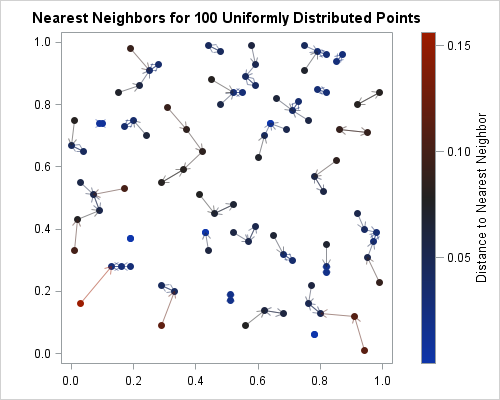
- Some statistical algorithms (such as clustering) rely on computing the distance from an observation to its nearest neighbor. This article shows how to compute nearest neighbors in SAS. A related article shows how to compute the distances between observations in one group and observations in a different group.
Matrix computations
The SAS DATA step is awesome. For many programming tasks, it is an efficient and effective tool. However, advanced analytical algorithms and multivariate statistics often require matrix-vector computations, which means programming in the SAS/IML language.
- SAS/IML 14.1 introduced packages. Packages are a new way to share SAS/IML programs. You can watch a video presentation about how to use and create packages.
- Statistical programmers often use the SAS/IML language to run custom optimizations. To help you navigate common pitfalls, this article presents a checklist of 10 tips to ensure that your optimizations are correct and efficient.
- SAS/IML is often used to carry out efficient simulation and bootstrap studies. This article describes how to implement the smooth bootstrap method in SAS/IML.
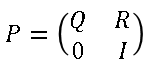
- Because SAS/IML is a matrix language, it is the ideal environment to implement Markov transition matrices. A related article shows that certain probabilities in Markov chains can be computed in terms of properties of the transition matrix.
There you have it, 10 articles from The DO Loop in 2016 that I think are worth a second look. Did I omit your favorite article? Leave a comment.

1 Comment
Very nice article and all worth looking at again.
My favorite article from 2016 was on how to highlight forecast regions in graphs:
http://blogs.sas.com/content/iml/2016/11/21/forecast-regions.html