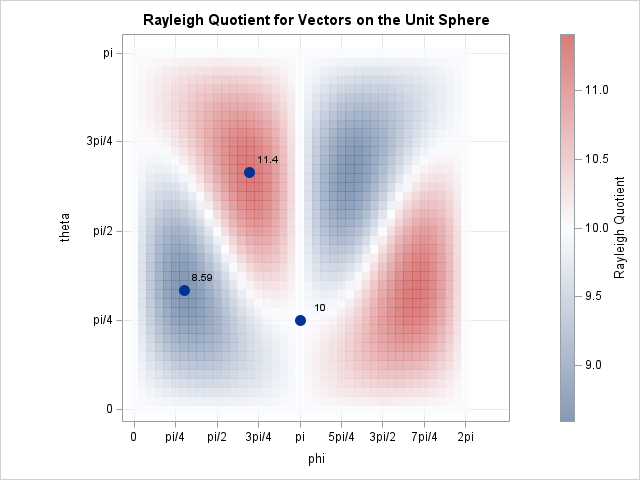
임상시험을 비롯한 모든 업무에서 분석은 필수이며, 점점 고급분석을 필요로하고 있습니다. 이번 블로그 포스팅은 2편으로 나누어 1편에서는 임상시험 전 과정에 참여한 내.외부 모든 이해관계자가 임상시험 데이터에 쉽게 접근하여 진행 상황을 파악할 수 있도록 지원하는 SAS Visual Analytics 솔루션의 기능을 소개합니다. 이어 2편에서는 임상시험의 SDTM 데이터를 활용하여 SAS Visual Analytics 솔루션에 어떻게
Uncategorized

2021年11月、国が一時停止している子宮頸がんを防ぐHPV(ヒトパピローマウイルス)ワクチンの積極的な接種の勧奨の再開が厚生労働省の専門家による検討部会によって正式に承認されました。このHPVワクチンは世界保健機関(WHO)がその接種を推進しており、日本をはじめとして多くの先進国では公的接種とされています。この記事はData for Good活動の一環として、パブリックデータを用いて問題を可視化することで、子宮頸がんに対する認知や関心をより持っていただき、今後のHPVワクチンの普及につなげることを目的としています。 子宮頸がん 子宮頸がんのほとんどはヒトパピローマウイルス(HPV)というウイルスの感染が原因となり子宮の頸部に発生するがんの一種です。感染の経路は主に性的接触によるものであり、成人女性の大部分はHPVに感染するとされています。HPVに感染してもその多くは自然に消失しますが、一部は頸部の細胞が異常な変化を起こした子宮頸部異形成というがんの前段階(前がん病変)になります。そしてさらにその一部が数年から10年ほどで悪性腫瘍へと進展し、子宮頸がんを発症します。この子宮頸部異形成(前がん病変)の早期段階では自覚症状はほぼなく、病変を発見するためには子宮頸がん検診を受けることが必要ですが、自覚症状があまりないために検診を受けた段階で既に進行がかなり進んでしまっているケースもあります。 国立がん研究センターがん情報サービスは国立がん研究センターが運営している公式サイトであり、日本国内のがんに関する統計情報ががん種別に公開されています。今回はその統計情報の中から、子宮頸がんに該当するデータ(がん種:子宮頸部)を抜き出し、無料で利用可能なSAS OnDemand for Academicsを利用して可視化を行いました。日本での死亡者数は2019年度時点で年間約3,000名、罹患者数は2018年時点で約11,000名ほどとなっており、下図のように増加の一途をたどっています。 出典:国立がん研究センターがん情報サービス「がん統計」(人口動態統計) より作成 ま子宮頸がんの罹患者数は2009年~2018年(最新)まで10年連続で1万人を超えており、罹患者数は30歳頃から増え始め現在は45-49歳が最も罹患が多い年代層となっています。また罹患する年齢層が若年化していることも危険視されています。子宮頸がんに対して我々ができることは以下の二つです。 子宮頸がん検診を受けること(発見) HPVワクチンを接種すること(予防) 私たちにとって重要なことは、2年に1度の受診が推奨されている子宮頸がん検診によって異形成(前がん病変)を早期に発見すること。そして検診と同様に重要ことが、HPVワクチンを接種し対応するHPVの感染を防ぎ、子宮頸がんとなるリスクを下げることです。 HPVワクチン 子宮頸がんの原因となるHPV(ヒトパピローマウイルス)は現在100種類以上の存在が知られており、そのうちのいくつかは子宮頸がんを引き起こしやすいハイリスク型に分類されます。HPVワクチンにも様々なタイプがありますが、日本では定期接種の対象となっているのは2価(サーバリックス)と4価(ガーダシル)のワクチンで、接種することでおおよそ50~70%程の感染を防ぎ子宮頸がんになるリスクを減らすことが可能です。また2021年2月24日からは9価ワクチンも日本での取り扱いが開始されましたが定期接種の対象ではないため自費での接種となっています。 「接種の積極的な勧奨」について HPVワクチンは下図のようにいくつかの事業、法案の後押しもあり、その対象となる年齢の女性へ接種の積極的な勧奨が行われていました。しかし公費での定期接種開始後に副反応の報告が相次ぎ、副反応と接種との因果関係や、その頻度、海外での詳しい実態調査が必要とされ、厚生労働省は約半年間をめどに「接種の積極的な勧奨」の一時中止という決定を2013年6月に下しました。当初は半年間がめどとされていたものの、一時停止はその後も続き、ワクチンの有効性が様々な研究により示され2021年11月に接種の積極的な勧奨の再開が正式に決定されるまで約8年の月日がかかりました。 専門家らの研究結果によると、接種の積極的な勧奨が一時停止されるまではおおよそ70%であった定期接種の対象年齢での接種率もこの一時停止により現在は1%未満にまで落ち込んでしまっています。論文のデータをもとに出生年ごとのワクチン接種率を可視化したものが下図です。 Nakagawa S, Ueda Y, Yagi A, Ikeda S, Hiramatsu K, Kimura T. Corrected human papillomavirus vaccination rates for each birth fiscal year in Japan. Cancer Sci. 2020;111(6):2156-2162. doi:10.1111/cas.14406 より作成

As we wrap up an outstanding year at the RFC, we want to take a moment to celebrate a year of innovation and creativity and thank YOU for joining us to take care of your health and wellness and have LOTS of FUN along the way. Here’s just a few
SAS Event Stream Processing (ESP) 2020버전 이상은 이제 클라우드 네이티브이며 쿠버네티스 환경에서 작동합니다. SAS ESP 프로젝트 개발자나 사용자가 새로운 환경을 효율적으로 활용하기 위해 알아야 할 몇 가지 사항이 있습니다. SAS ESP "factory" 서버가 더 이상 필요하지 않습니다 이전에는 SAS ESP 6.2 및 이전 버전에서 개발자가 ESP 프로젝트를 설계하기 위해 먼저

SAS' Kelly Fellingham, an advanced analytics software developer, reveals how SAS software's new SASEBEA interface helps you identify patterns in US economics data.

It is increasingly possible to use text analytics to explore different types of data. When a news story this summer caught my eye, I decided to see if I could use SAS Visual Text Analytics (VTA) and SAS Visual Analytics (VA) on customer complaints to provide information that might be

This is a post from a few years back, pre-COVID. It seems particularly timely as many of us may now be planning a visit to see older adults in our family that we have been separated from due to the pandemic. As the holidays approach, one of the highlights
지불/결제(Payments) 사기는 악의를 가진 누군가가 다른 사람의 개인 결제 정보를 훔치거나 속여 빼낸 다음 해당 정보로 허위 또는 불법 거래에 사용할 때 발생합니다. 새로운 결제 수단이나 서비스가 인기를 끌 때마다 결제 환경과 트렌드가 바뀝니다. 사기범들도 마찬가지입니다. 그들은 새롭고 점점 더 교묘해지는 지불/결제 사기 수법을 개발하여 새로운 환경에 적응합니다. 사기범은 사기를

Introduction In an era of high connectivity and instant gratification, the expectations of customer experience have never been higher. Customers do not simply want but rather expect accessible and responsive communication across a variety of channels. And for organisations, the risks have never been higher. Disgruntled users now have the

1회. 도입 목적과 범위, AML Compliance Analytics Maturity Model 자금세탁 방지 의무가 있는 대부분의 금융 기관과 기업은 자금세탁 방지와 관련된 컴플라이언스 업무 수행을 위해 막대한 인력, 시간, 비용, 노력을 투자하고 있습니다. 자금 세탁 방지 컴플라이언스는 FATF가 설립된 1989년 이후 자금세탁 방지(AML;Anti-Money Laundering), 테러자금조달 방지(CFT; Countering the Financing of Terrorism), 대량살상무기

As we come to the end of the year when gift giving is popular, there is nothing kinder than making something special for family, friends and loved ones. It’s a double win because many products on the shelves today contain chemicals or harmful substances that our bodies are unfamiliar with

The 2021 SAS Hackathon was a major success and teams are now signing up for the 2022 hackathon. We are inviting you to join us. The world has lots of problems in search of answers and it’s your chance to contribute some creative solutions. Here’s what the team from KPMG

Suppose you are creating a craft project for the Christmas holidays, and you want to choose a palette of Christmas colors to give it a cheery holiday appearance. You could use one of the many online collections of color palettes to choose a Christmas-themed palette. However, I didn't want to

It's that time of year again where I get to blend together a holiday song with analytics. This is the eighth year running and the 11th song. For 2021, I decided to take on a more modern holiday song, Arianna Grande's Winter Things. Data Science Things SQL and reporting ain’t

Active gratitude is the feeling you get when a stranger does something nice for you without expecting anything in return. While both are beneficial for our health, there is a statistically significant, positive correlation between active gratitude and pro-sociality (r = 0.374), that is not present with passive gratitude. In other words, random acts of kindness trigger other random acts of kindness to other people, which is both good for us and good for society.

In a previous article, I visualized seven Christmas-themed palettes of colors, as shown to the right. You can see that the palettes include many red, green, and golden colors. Clearly, the colors in the Christmas palettes are not a random sample from the space of RGB colors. Rather, they represent

There is no shortage of challenges associated with the deployment of AI: a lack of access to infrastructure, a lack of skills, and new legislation meant to enforce the responsible use of this evolving technology. But the most consequential questions facing us are innately human. Namely, ensuring human agency, safety
Hyper Automation, 초(超) 자동화 제조, 여신, 물류 등의 산업군 및 마케팅, 영업 등의 직군에 종사하신다면 자동화(Automation)라는 용어는 그리 낮 설지 않은 용어일 것 입니다. 자동화는 인간의 노동 효율을 극대화하기 위해 인간의 개입을 최소화 하고 기계 또는 컴퓨터의 능력을 활용하는 방향으로 진화해 왔습니다. 예를 들어 마케팅 영역에서의 자동화의 경우, 마케팅 전략을

The threat of fraud is ever-present and growing. Organizations lose around 5% of their annual revenues to fraud, and many of them don't take sufficient proactive measures. It's notable that only 56% of organizations conduct investigations of even their worst incidents. That statistic is based on the 2020 ACFE Report

In data visualization, colors can represent the values of a variable in a choropleth map, a heatmap, or a scatter plot. But how do you visualize a palette of colors from the RGB or hexadecimal values of the colors? One way is to use the HEATMAPDISC subroutine in SAS/IML, which

We made bold predictions a year ago about what 2021 would bring. We’re bold enough to do it again for 2022. The pandemic disrupted traditional ways of life in 2021. Remote learning and working became the norm for many. Telehealth took off, and IT modernization accelerated in every industry. 2021

While discussing how to compute convex hulls in SAS with a colleague, we wondered how the size of the convex hull compares to the size of the sample. For most distributions of points, I claimed that the size of the convex hull is much less than the size of the

The clock is ticking as the end of third-party data is near. Safari and Firefox have eliminated third-party cookies and Google Chrome is not far behind. Below are three steps marketers can take to address the changing cookie landscape: Create moments that matter by providing a digital experience that convinces

A team of SAS employees recently participated in a data-for-good project focusing on forest fires in the Amazon. In conjunction with the Amazon Conservation Association (ACA), the team explored options to collect and analyze publicly available imagery and fire data to better understand the drivers for forest fires as well

Whatever you choose to call it – learning loss, learning disruption, or unfinished learning – there is widespread agreement among educators, parents, and other caregivers focused on the needs of K-12 learners that COVID-19-related disruptions had a serious impact on their education. But dig a little deeper and the story

Did you know that the loess regression algorithm is not well-defined when you have repeated values among the explanatory variables, and you request a very small smoothing parameter? This is because loess regression at the point x0 is based on using the k nearest neighbors to x0. If x0 has

In a Q&A with SAS' Udo Sglavo, Xilong Chen of SAS parses the work of 2021 Nobel Prize winners for Economics.

A scatter plot is my go-to graph! It's what I often start with to get a feel for the data ... and I often end up using just a scatter plot. But some scatter plots are better than others ... In this blog post, I create a scatter plot of

When SAS 9 programmers transition to SAS Viya, there are inevitably questions about how new concepts in Cloud Analytic Services (CAS) relate to similar concepts in SAS. This article discusses the question, "What is the difference between a libref and a caslib?" Both are used to access data, but they

Fast-changing payment scams are on the rise. Learn how to fight back.