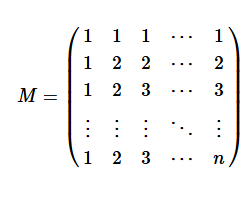
A previous article discusses the geometry of weighted averages and shows how choosing different weights can lead to different rankings of the subjects. As an example, I showed how college programs might rank applicants by using a weighted average of factors such as test scores. "The best" applicant is determined
Author
People love rankings. You've probably seen articles about the best places to live, the best colleges to attend, the best pizza to order, and so on. Each of these is an example of a ranking that is based on multiple characteristics. For example, a list of the best places to
One of the benefits of using the SWEEP operator is that it enables you to "sweep in" columns (add effects to a model) in any order. This article shows that if you use the SWEEP operator, you can compute a SSCP matrix and use it repeatedly to estimate any linear
Do you ever use a permutation matrix to change the order of rows or columns in a matrix? Did you know that there is a more efficient way in matrix-oriented languages such as SAS/IML, MATLAB, and R? Remember the following tip: Never multiply with a large permutation matrix! Instead, use
In a previous article, I discussed a beautiful painting called "Phantom’s Shadow, 2018" by the Nigerian-born artist, Odili Donald Odita. I noted that if you overlay a 4 x 4 grid on the painting, then each cell contains a four-bladed pinwheel shape. The cells display rotations and reflections of the pinwheel. The
Art evokes an emotional response in the viewer, but sometimes art also evokes a cerebral response. When I see patterns and symmetries in art, I think about a related mathematical object or process. Recently, a Twitter user tweeted about a painting called "Phantom’s Shadow, 2018" by the Nigerian-born artist, Odili
A SAS programmer recently asked why his SAS program and his colleague's R program display different estimates for the quantiles of a very small data set (less than 10 observations). I pointed the programmer to my article that compares the nine common definitions for sample quantiles. The article has a
To get better at something, you need to practice. That maxim applies to sports, music, and programming. If you want to be a better programmer, you need to write many programs. This article provides an example of forming the intersection of items in a SAS/IML list. It then provides several
After my recent articles on simulating data by using copulas, many readers commented about the power of copulas. Yes, they are powerful, and the geometry of copulas is beautiful. However, it is important to be aware of the limitations of copulas. This article creates a bizarre example of bivariate data,
In a previous article, I discussed various ways to solve a least-square linear regression model. I discussed the SWEEP operator (used by many SAS regression routines), the LU-based methods (SOLVE and INV in SAS/IML), and the QR decomposition (CALL QR in SAS/IML). Each method computes the estimates for the regression
In computational statistics, there are often several ways to solve the same problem. For example, there are many ways to solve for the least-squares solution of a linear regression model. A SAS programmer recently mentioned that some open-source software uses the QR algorithm to solve least-squares regression problems and asked
In general, it is hard to simulate multivariate data that has a specified correlation structure. Copulas make that task easier for continuous distributions. A previous article presented the geometry behind a copula and explained copulas in an intuitive way. Although I strongly believe that statistical practitioners should be familiar with
Do you know what a copula is? It is a popular way to simulate multivariate correlated data. The literature for copulas is mathematically formidable, but this article provides an intuitive introduction to copulas by describing the geometry of the transformations that are involved in the simulation process. Although there are
A recent article about how to estimate a two-dimensional distribution function in SAS inspired me to think about a related computation: a 2-D cumulative sum. Suppose you have numbers in a matrix, X. A 2-D cumulative sum is a second matrix, C, such that the C[p,q] gives the sum of
This article shows how to estimate and visualize a two-dimensional cumulative distribution function (CDF) in SAS. SAS has built-in support for this computation. Although the bivariate CDF is not used as much as the univariate CDF, the bivariate version is still a useful tool in understanding the probable values of
This article uses simulation to demonstrate the fact that any continuous distribution can be transformed into the uniform distribution on (0,1). The function that performs this transformation is a familiar one: it is the cumulative distribution function (CDF). A continuous CDF is defined as an integral, so the transformation is
A SAS programmer noticed that his SAS output was not displaying multiple blanks in his strings. He had some strings with leading blanks, others with trailing blanks, and others with multiple blanks in the middle. Yet, every time he used SAS to print the strings to the HTML destination, something
A previous article showed how to simulate multivariate correlated data by using the Iman-Conover transformation (Iman and Conover, 1982). The transformation preserves the marginal distributions of the original data but permutes the values (columnwise) to induce a new correlation among the variables. When I first read about the Iman-Conover transformation,
Simulating univariate data is relatively easy. Simulating multivariate data is much harder. The main difficulty is to generate variables that have given univariate distributions but also are correlated with each other according to a specified correlation matrix. However, Iman and Conover (1982, "A distribution-free approach to inducing rank correlation among
Many nonparametric statistical methods use the ranks of observations to compute distribution-free statistics. In SAS, two procedures that use ranks are PROC NPAR1WAY and PROC CORR. Whereas the SPEARMAN option in PROC CORR (which computes rank correlation) uses only the "raw" tied ranks, PROC NPAR1WAY uses transformations of the ranks,
For many univariate statistics (mean, median, standard deviation, etc.), the order of the data is unimportant. If you sort univariate data, the mean and standard deviation do not change. However, you cannot sort an individual variable (independently) if you want to preserve its relationship with other variables. This statement is
It is well known that classical estimates of location and scale (for example, the mean and standard deviation) are influenced by outliers. In the 1960s, '70s, and '80s, researchers such as Tukey, Huber, Hampel, and Rousseeuw advocated analyzing data by using robust statistical estimates such as the median and the
When data contain outliers, medians estimate the center of the data better than means do. In general, robust estimates of location and sale are preferred over classical moment-based estimates when the data contain outliers or are from a heavy-tailed distribution. Thus, instead of using the mean and standard deviation of
I refer to the SAS documentation every day. Usually, I want information about SAS syntax and the statistical formulas and algorithms for various options and statements. Although I have bookmarked common documentation books and chapters, sometimes it is easier to perform an internet search to find information. I've discovered a
A SAS programmer noticed that there is not a built-in function in the SAS DATA step that computes the product for each row across a specified set of variables. There are built-in functions for various statistics such as the SUM, MAX, MIN, MEAN, and MEDIAN functions. But no DATA step
I previously wrote about how to understand standardized regression coefficients in PROC REG in SAS. You can obtain the standardized estimates by using the STB option on the MODEL statement in PROC REG. Several readers have written to ask whether I could write a similar article about the STDCOEF option
You can standardize a numerical variable by subtracting a location parameter from each observation and then dividing by a scale parameter. Often, the parameters depend on the data that you are standardizing. For example, the most common way to standardize a variable is to subtract the sample mean and divide
Odani's truism is a mathematical result that says that if you want to compare the fractions a/b and c/d, it often is sufficient to compare the sums (a+d) and (b+c) rather than the products a*d and b*c. (All of the integers a, b, c, and d are positive.) If you
Quick! Which fraction is bigger, 40/83 or 27/56? It's not always easy to mentally compare two fractions to determine which is larger. For this example, you can easily see that both fractions are a little less than 1/2, but to compare the numbers you need to compare the products 40*56
A previous article discusses the definition of the Hoeffding D statistic and how to compute it in SAS. The letter D stands for "dependence." Unlike the Pearson correlation, which measures linear relationships, the Hoeffding D statistic tests whether two random variables are independent. Dependent variables have a Hoeffding D statistic