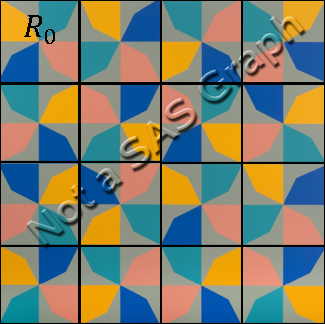
In a previous article, I discussed a beautiful painting called "Phantom’s Shadow, 2018" by the Nigerian-born artist, Odili Donald Odita. I noted that if you overlay a 4 x 4 grid on the painting, then each cell contains a four-bladed pinwheel shape. The cells display rotations and reflections of the pinwheel.
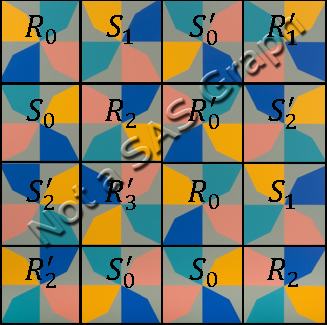
The figure at the right overlays the grid on Odita's painting. The cell in the upper right (marked R0) displays one pinwheel. When I first saw Odita's artwork, I thought that all 16 cells were a rotation or reflection of this one pinwheel. However, it turns out that Odita's work contains a mathematical twist. To generate all the pinwheels in the image, you need to use two different colorings of the pinwheel. The first coloring is (in counter-clockwise order) teal, orange, blue, and salmon. The second coloring is teal, salmon, blue, and orange. You cannot get the second colored pinwheel by rotating and reflecting the first.
Rotations and reflections of a pinwheel
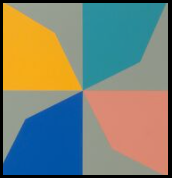
The "fundamental pinwheel" (R0) is displayed to the left. As I showed in the previous article, you can generate this pinwheel by starting with a four-sided polygon and rotating it around the origin.
For simplicity, you can start with the coordinates of the pinwheel. The following SAS data set contains the coordinates of the pinwheel vertices. As shown in the previous article, you can use the POLYGON statement in PROC SGPLOT to visualize the pinwheel.
data Shape; input ID x y @@; datalines; 0 0 0 0 0.667 0.333 0 1 1 0 0 1 0 0 0 1 0 0 1 -0.333 0.667 1 -1 1 1 -1 0 1 0 0 2 0 0 2 -0.667 -0.333 2 -1 -1 2 0 -1 2 0 0 3 0 0 3 0.333 -0.667 3 1 -1 3 1 0 3 0 0 ; |
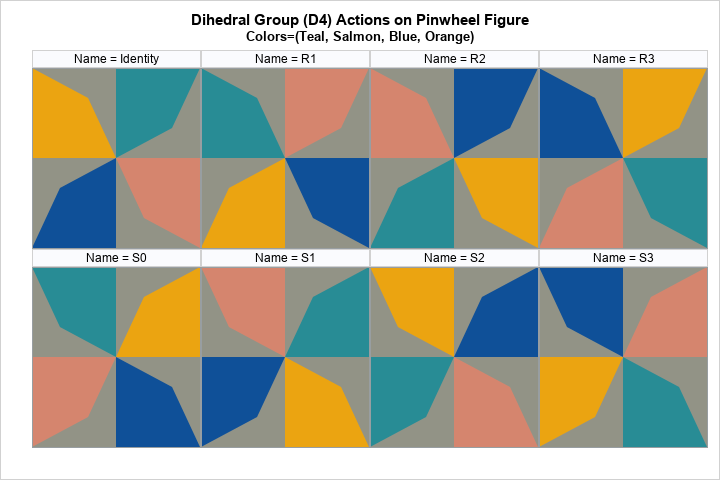
If you ignore the colors, the pinwheel shape has rotational and reflectional symmetries. Let's understand how this pinwheel looks when it is rotated or reflected under the symmetries of the square. The symmetries make up a finite group of order eight, which is known as the dihedral group of the square or D4. The group has a representation in terms of eight 2 x 2 orthogonal matrices. The following SAS/IML program defines a function that will transform a planar set of points according to one of the matrices in the dihedral group. The program reads the pinwheel coordinates into a data matrix and transforms the pinwheel according to each element of D4. The results are plotted by using PROC SGPANEL:
proc iml; /* actions of the D4 dihedral group */ start D4Action(v, act); /* the subroup of rotations by 90 degrees */ if act=0 then M = { 1 0, 0 1}; else if act=1 then M = { 0 -1, 1 0}; else if act=2 then M = {-1 0, 0 -1}; else if act=3 then M = { 0 1, -1 0}; /* the subgroup of reflections across horz, vert, or diagonals */ else if act=4 then M = {-1 0, 0 1}; else if act=6 then M = { 0 -1, -1 0}; else if act=7 then M = { 1 0, 0 -1}; else if act=5 then M = { 0 1, 1 0}; return( v*M` ); /* = (M*z`)` */ finish; /* read in the pinwheel shape */ use Shape; read all var {x y} into P; read all var "ID"; close; /* write out the transformation of the pinwheel under the D4 actions */ OpNames = {"Identity" "R1" "R2" "R3" "S0" "S1" "S2" "S3"}; Name = OpNames[1]; Q = {. . .}; create Panel from Name Q[c={'Name' 'ID' 'x' 'y'}]; do i = 0 to 7; R = D4Action(P, i); Q = ID || R; Name = j(nrow(Q), 1, OpNames[i+1]); append from Name Q; end; close; QUIT; ods graphics / width=720px height=480px; /* for convenience, define macros for the COLAXIS and ROWAXIS options */ %macro colOpts; colaxis offsetmin=0 offsetmax=0 display=(nolabel noticks novalues); %mend; %macro rowOpts; rowaxis offsetmin=0 offsetmax=0 display=(nolabel noticks novalues); %mend; title "Dihedral Group (D4) Actions on Pinwheel Figure"; title2 "Colors=(Teal, Orange, Blue, Salmon)"; proc sgpanel data=Panel noautolegend; styleattrs wallcolor=&gray datacolors=(&teal &orange &blue &salmon); panelby Name / columns=4 onepanel; polygon x=x y=y ID=ID / group=ID fill; %colOpts; %rowOpts; run; |

The labels for each cell indicate the element of D4 that transforms the original pinwheel. The first row represents rotations by 0, 90, 180, and 270 degrees. The second row represents a vertical reflection (S0), a reflection across a diagonal line (S1), a reflection across a different diagonal (S2), and a horizontal reflection (S3). As mentioned earlier, I assumed that these eight images would be sufficient to reproduce the cells in Odita's artwork, but I was wrong. Let's look at the 16 cells in Odita's image and label each cell according to the elements of the D4 dihedral group:
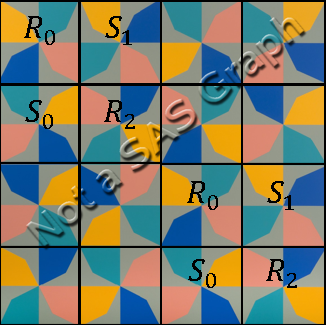
I was surprised to discover that only half of the cells are transformations of the upper-left pinwheel. Furthermore, the four cells in the upper-left corner are arranged in the same order as the four cells in the lower-right corner. Out of the eight possible transformations of the pinwheel under the D4 group, Odita only uses four. The remaining cells either have the colors in a different order or have the "vane" of the pinwheel pointing in a different direction.
A second generator
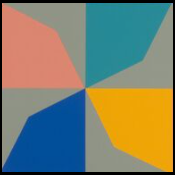
Mathematically, Odita's pattern has a second pinwheel "generator." You could choose any of the unlabeled cells to be the generator of the remaining cells, but I will choose the cell on the second row and third column, which is displayed to the left.
For this pinwheel, the vanes are pointing in the same direction as the first pinwheel, but the colors (in counter-clockwise order) are teal, salmon, blue, and orange. Notice that the salmon and orange colors have switched their order.
In terms of the SAS data set, we can create this new colored pinwheel by switching the ID variable for the observations that have ID=1 and ID=3. You can then create a panel of images for this new pinwheel under the dihedral transformations, as follows:
/* switch the colors of the 2nd and 4th vanes */ data Panel2; set Panel; if ID=1 then ID=3; else if ID=3 then ID=1; run; title "Dihedral Group (D4) Actions on Pinwheel Figure"; title2 "Colors=(Teal, Salmon, Blue, Orange)"; proc sgpanel data=Panel2 noautolegend; styleattrs wallcolor=&gray datacolors=(&teal &orange &blue &salmon); panelby Name / columns=4 onepanel; polygon x=x y=y ID=ID / group=ID fill; %colOpts; %rowOpts; run; |
Let's use a prime to distinguish the elements of this second panel. That is, the first row represents the elements R`0, R`1, R`2, and R`3. The second row represents the elements S`0, S`1, S`2, and S`3. We can use these labels to identify the remaining cells in Odita's work, as follows:
The remaining eight cells display six of the possible patterns for the dihedral actions on the second generator. The S`0 and S`2 actions are repeated. The S`1 and S`3 actions do not appear.
Using SAS to generate mathematical art
Now that we have identified all the cells in Odita's painting, we could actually use PROC SGPANEL in SAS to create a mathematical reproduction of his work. Or, we can use SAS to create new Odita-inspired images.
I will do the latter. The following statements stack the panels of the dihedral group for the two fundamental pinwheels:
data Pinwheels; length Name $20; set Panel Panel2; Group = floor((_N_-1)/20); run; ods graphics / width=640px height=640px; title "Dihedral Shadow"; proc sgpanel data=Pinwheels noautolegend; styleattrs wallcolor=&gray datacolors=(&teal &orange &blue &salmon); panelby Group / columns=4 onepanel noheader; polygon x=x y=y ID=ID / group=ID fill; %colOpts; %rowOpts; run; |
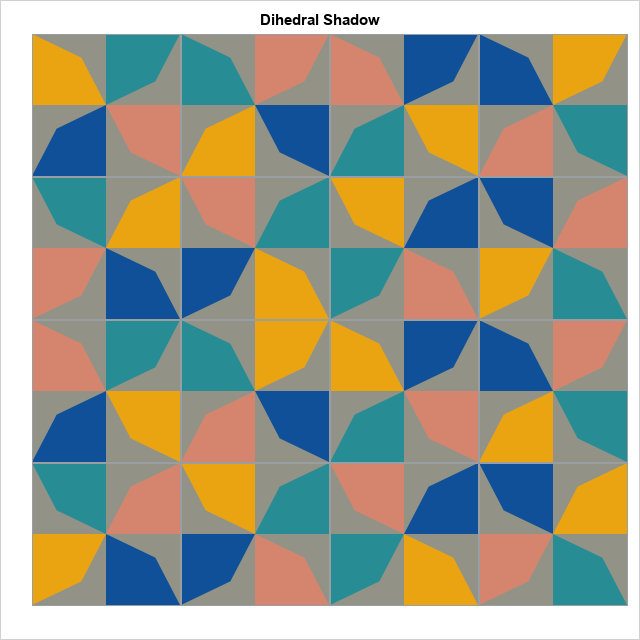
In homage to Odita, I name this mathematical image "Dihedral's Shadow." The first two rows show the actions (rotations and reflections) of the D4 dihedral group on a pinwheel shape whose colors are in the sequential order "teal, orange, blue, and salmon." The last two rows show the dihedral actions on a pinwheel shape whose colors are in the order "teal, salmon, blue, and orange."
Notice that this mathematical image does not share some of the aesthetic properties of Odita's work. In Odita's image, the colors of the polygons are chosen so that the four neighbors (up-down and left-right) of a polygon are different colors from the polygon itself. My creation does not have that property. For example, if you think of the image as an 8 x 8 grid and traverse the first row, you see two teal polygons followed by two salmon polygons followed by two blue polygons. In Odita's work, no row has two adjacent polygons that have the same color.
I don't like the three orange polygons in the middle of my image. Odita arranged his pinwheel images to avoid neighboring polygons that have the same color. I suppose I could try arranging the pinwheels in a different order.
Summary
There is much more that could be said about the mathematical structures in Odita's work, "Phantom’s Shadow, 2018." In this article, I show how you can analyze components of the painting as reflections and rotations of two four-color pinwheel-shaped figures. Mathematically, these images can be generated by using orthogonal matrices. The images can be assembled into a lattice by using PROC SGPANEL in SAS.
This article shows how to create a purely mathematical image: the dihedral actions on two pinwheel shapes. It arranges the images without consideration of how a pinwheel looks adjacent to its neighbors. In a triumph of art over mathematics, I think Odita's art is more pleasing than my imitation.
Would you like to use SAS to create mathematical art? You can download the SAS program that I used to create the images in this article. I challenge my readers to use the Pinwheels data set to create their own mathematical works. You can use one of the following ideas, or explore your own ideas:
- The design of experiments uses arrays to describe factors that are varied in the experiment. Use these pinwheel images to create a visual representation of an experimental design. The factors are rotation (4 levels), reflection (4 levels), and color-sequence (2 levels).
- Rearrange the cells in "Dihedral's Shadow" to reduce the number of adjacent polygons that have the same color. You can do this manually, but extra points if you use math or SAS/OR software to minimize the number of adjacent polygons that have the same color!
- Use a random number generation to create a random arrangement of the pinwheels.
I have created a thread on the SAS Support Communities that you can use to post your own creations. Have fun!

3 Comments
Pingback: The art of rotations and reflections - The DO Loop
Just wanted to say I love your blog and this post!! I am working on a crocheted temperature blanket and your blog has got me thinking I could try out colors and patterns and estimate yarn amounts using SAS if I wanted and had the time for a future temperature blanket. Maybe something fun to do when I retire :) Simulate weather similar to historical weather and "make" simulated blankets with different patterns and colors.
Thanks for writing. Your idea sounds like a lot of fun. I don't know how easy it is to change yarn colors when you crochet, but here's a link to a "wind-chill chart" that might make a pretty blanket: https://blogs.sas.com/content/iml/2021/03/01/wind-chill-chart-sas.html