A previous article discusses the geometry of weighted averages and shows how choosing different weights can lead to different rankings of the subjects. As an example, I showed how college programs might rank applicants by using a weighted average of factors such as test scores. "The best" applicant is determined by the choice of weights. If you change the weights, you change the definition of "the best."
The same ideas can be used to rank sports teams at tournaments. For some sports, the governing body dictates how to rank teams based on the team's performance in individual events. However, I can think of at least one popular international sporting event that awards medals (gold, silver, and bronze) to individual athletes, but does not endorse a method for converting the number of medals won into a team score. Accordingly, fans have suggested multiple ranking methods. This article discusses various ranking methods and shows how the rankings change for each method.
Some sports have established weights
For some sports, the governing body has published how to rank teams based on the performance of team members in individual events. Some sports use different scoring systems at different levels of competition, but a few representative systems are listed below.
- In the group stage of World Cup soccer, teams get 3 points for a win, 1 point for a draw, and 0 points for a loss. Thus, team ranks are based on the weights (3, 1, 0).
- In some swimming leagues, the team of the first-place winner in an individual event is awarded 6 points. Subsequent places are awarded 4, 3, 2, and 1 point. Swimmers who do not score in the top five do not score points. So team scores (for individual events) are based on the weights (6,4,3,2,1,0,0,0), if you use an eight-lane pool.
Notice a key characteristic of these weight vectors: More weight is given for finishing first. In fact, the weights tend to be decreasing (or at least not increasing) so that the first-place team gets more points than the second-place team, which gets more points than the third-place team, and so on.
Medals at international competitions
One popular sporting tournament awards medals to the top-three individuals but does not endorse a formula that converts medals into a team score. But that doesn't prevent fans from coming up with their own formulas! Some fans argue that "the best" team is the one with the most gold medals. Others argue that the team that has the most overall medals is the best. Others favor a weighted scheme in which a gold medal is worth more than a silver, which is worth more than a bronze. This last scheme has many variations, depending upon how much weight you assign to each medal.
Suppose that the i_th team wins Gi gold medals, Si silver medals, and Bi bronze medals. In a weighting scheme, you choose the weights for gold, silver, and bronze medals. If the vector w = (wG, wS, wB) contains the weights, then the score for each team is computed as Si = wG*Gi + wS*Si + wB*Bi. In addition, we impose the constraints that wG ≥ wS ≥ wB ≥ 0.
Equal weights: A popular weighting method
Many media outlets report the total medals awarded, so let's start by looking at the weighting scheme with the weight vector w = (1, 1, 1). For data, let's use the medal counts from an international competition that took place in Tokyo, Japan. You can use PROC RANK in SAS to rank the teams according to the total number of medals, as follows:
/* Data for medals awarded at the 2020 Summer Games (Tokyo, Japan) for the 25 teams who won the most medals. Data from Wikipedia: https://bit.ly/3yQuz0g */ data Medals2020; length Team $15; input Team 1-15 Gold Silver Bronze; Total = Gold + Silver + Bronze; /* equal weights: w = (1, 1, 1) */ Order = _N_; datalines; United States 39 41 33 P.R. of China 38 32 18 ROC (Russia) 20 28 23 Great Britain 22 21 22 Japan 27 14 17 Australia 17 7 22 Italy 10 10 20 Germany 10 11 16 Netherlands 10 12 14 France 10 12 11 Canada 7 6 11 Brazil 7 6 8 New Zealand 7 6 7 Hungary 6 7 7 Rep. of Korea 6 4 10 Ukraine 1 6 12 Spain 3 8 6 Cuba 7 3 5 Poland 4 5 5 Switzerland 3 4 6 Turkey 2 2 9 Chinese Taipei 2 4 6 Czech Republic 4 4 3 Denmark 3 4 4 Kenya 4 4 2 ; proc rank data=Medals2020 out=Rank ties=Low descending; var Total; ranks Rank; run; ods graphics /width=400px height=600px; title "Teams Ranked by Total Medals"; proc sgplot data=Rank; hbar Team / response=Total datalabel=Rank; yaxis discreteorder=data display=(nolabel); xaxis grid label="Total Medals"; run; |
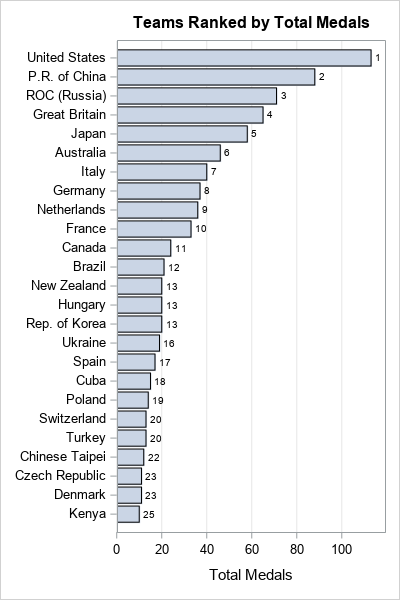
The graph displays the total medal count for 25 participating teams. The number to the right of each bar is the rank for the team when you choose equal weights for the medals. This is merely one weighting method that you can use.
Under this set of weights, a team that wins 10 gold medals (and nothing else) gets the same rank as a team that wins 10 bronze medals (and nothing else). To some, this seems unfair to the first team. Consequently, it makes sense to consider weights for which gold is weighted more than silver, which is weighted more than bronze.
Alternative weighting methods
Let's see how these rankings change if you choose a different set of weights. If you intend to compare different methods, it is useful to scale the weight vectors so that the "total weight" is unity. Thus, you would modify the previous weight vector to w = (1, 1, 1)/3, which is interpreted as "1/3 of the score comes from the number of gold medals, 1/3 comes from the number of silver medals, and 1/3 comes from the number of bronze medals." The following methods are popular choices for weights. For more about methods for weighting medal counts, see Wood, R. (2010) "Comparison of Weighted Ranking Systems."
- Most Medals: w=(1,1,1)/3.
- Most Gold Medals: w=(1,0,0).
- Arithmetic weights: w=(3,2,1)/6. This method values a gold medal as equal to one silver and one bronze.
- Geometric weights: w=(4,2,1)/7. For this method, gold medal equals two silvers. A silver medal equals two bronzes.
- London 1908: w=(5,3,1)/9. This set of weights was used at the 1908 London Games.
You can use the SAS DATA step to compute the scores for each team under each different weighting scheme:
data WeightedScores; length Wt $24; set Medals2020; Method=1; Wt="Most Medals: w=(1,1,1)/3"; Score = (1*Gold + 1*silver + 1*Bronze)/3; output; Method=2; Wt="Most Gold: w=(1,0,0)"; Score = 1*Gold + 0*silver + 0*Bronze; output; Method=3; Wt="Arithmetic: w=(3,2,1)/6"; Score = (3*Gold + 2*silver + 1*Bronze)/6; output; Method=4; Wt="Geometric: w=(4,2,1)/7"; Score = (4*Gold + 2*silver + 1*Bronze)/7; output; Method=5; Wt="London 1908: w=(5,3,1)/9"; Score = (5*Gold + 3*silver + 1*Bronze)/9; output; run; /* Use PROC RANK to run a BY-group analysis for these weighting methods */ proc sort data=WeightedScores; by Method; run; proc rank data=WeightedScores out=Ranks ties=Low descending; by Method; var Score; ranks Rank; run; /* prepare data for graphing */ proc sort data=Ranks; by Method Order; run; ods graphics /width=900px height=600px; title "Teams Ranked by Alternative Weighting Schemes"; proc sgpanel data=Ranks; where Method^=1; panelby Wt / novarname rows=1 onepanel sort=data; hbar Team / response=Score datalabel=Rank; colaxis grid label="Weighted Score"; rowaxis discreteorder=data display=(nolabel); run; |
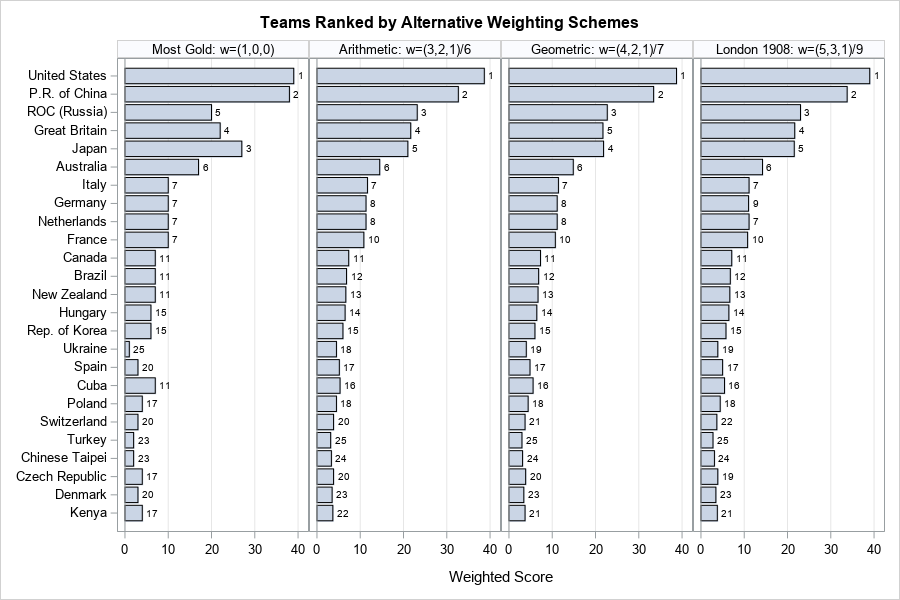
Click on the panel to enlarge the graph. In the panel, the teams are listed according to the total number of medals. In each panel, the length of the bar shows the team scores under a different weighting scheme. The numbers to the right of the bars indicate the team ranks. For these data, all methods consistently rank USA and China as the top teams. However, the ranks of other teams move around as you change the weighting criteria. Pay particular attention to teams that have an unequal distribution of medal types, such as Ukraine (1 gold; 6 silver; 12 bronze), Cuba (7 gold, 3 silver, and 5 bronze), and Turkey (2 gold, 2 silver, 9 bronze). For methods that give gold much more weight than bronze, Cuba will rank higher, and Ukraine and Turkey will rank lower, relative to using equal weights.
- If you use the "Most Gold" ranking, Japan's team leapfrogs into third place, followed by the UK. A problem with the "Most Gold" ranking is that it results in many ties. For example, four teams are tied for seventh place. Should Italy (10 gold; 10 silver; 20 bronze) rank the same as France (10 gold; 12 silver; 11 bronze)? Maybe so, maybe not!
- If you use the "Arithmetic Ranking," the teams at the top of the list do not change. It is not until you compute the scores for Cuba and Spain that you start to see teams switch places in the rankings. Teams that move down in the rankings are those who won a relatively large number of bronze medals.
- If you use the "Geometric Ranking," Japan and the UK switch places at the top of the ranks, but mostly the changes occur lower in the rankings. As expected, Ukraine, Cuba, and Turkey are heavily affected.
- The "London 1908" method is very similar to the "Arithmetic" ranking. The London method uses an arithmetic progression of weights, but the step size is 2 instead of 1.
Summary
Rankings are everywhere. Behind every ranking is a vector of weights that assigns the relative importance of the factors. As demonstrates in these articles, if you change the weights, you will change the scores, which often change the rankings. Consequently, when you see a ranking reported in the media, you should think about what criteria (and biases!) are used to create the ranking. Are they the same criteria that you value? Furthermore, you should realize that a slight tweak to the weights will often change the rankings. A team that is ranked 10th in one set of rankings might be ranked considerably higher or lower if you use slightly different criteria. When the rankings are based on statistical quantities (such as means and proportions), you can add confidence limits that quantify the uncertainty in the rankings.
Although the example uses sports teams, the same analysis is generally applicable for ranking other quantities: stocks, loan applicants, suppliers, job applicants, and so forth.
