People love rankings. You've probably seen articles about the best places to live, the best colleges to attend, the best pizza to order, and so on. Each of these is an example of a ranking that is based on multiple characteristics. For example, a list of the best places to live might base the ranking on quantities such as the average salary, the cost of homes, crime rates, quality of schools, and so forth. Pizzas might be ranked on the crust, the sauce, the toppings, and more. Typically, the ranking is a weighted average of these multiple variables.
Inevitably, after the rankings are released, some people complain that the weights used to construct the ranking were not fair. The most common complaint is that the weights were chosen arbitrarily by the editors. This is a valid criticism: someone must choose the weights, but not everyone will agree with the choice. Some organizations base the weights on surveys in which people are asked to weigh the relative importance of the factors. Other organizations might use equal weights for the characteristics. Others just make up weights that seem to work well.
This article discusses the geometry of a weighted mean (or sum) of multiple variables. When you specify the weights, you are choosing a direction (a line) in the space of the variables. Geometrically, each subject (city, college, pizza, ...) is projected onto the line. The ranking is then determined by the relative placement of each subject when projected onto the line. This is shown visually by the graph to the right. The details of the graph are explained later in this article.
Mathematically, a weighted mean and a weighted sum are very similar and result in the same ranks. I will use the weighted sum in this article. If you prefer, you can get the weighted mean by dividing the weighted sum by the number of factors. Also, a projection onto a line requires scaling the weight vector to have unit length, but I will ignore that technical detail.
Two-dimensional rankings
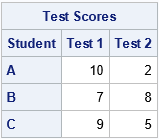
To illustrate the geometry of ranking subjects, consider the case where there are only two characteristics. Suppose three students are being evaluated for admission to a university program. Each subject submits two scores on a standardized test. The following table shows the test scores for the three students:
Which student is the best fit for the university program? It depends on how the program weights the two test scores. Let's pretend that "Test 1" is a test of mathematical and analytical skills and that "Test 2" is a test of verbal and language skills. Some programs (math, engineering, and other STEM disciplines) will put extra weight on the math score, whereas other programs (creative writing, linguistics, journalism, ...) will put extras weight on the verbal score. Here are a few ways that various programs might weigh the tests:
- A math department might look only at the math test and ignore the language test. This corresponds to the weight vector w1=(1,0).
- A law school might want to equally weigh the math and language tests. This corresponds to the weight vector w2=(1,1).
- An engineering program might decide that math skills are twice as important as language skills. This corresponds to the weight vector w3=(2,1).
The following table displays the weighted sums for each student under these different choices for weights:
The table shows that the "best" candidate depends on the weights that the programs choose:
- For the math department ("Wt Sum 1"), Student A is the best candidate.
- For the law school ("Wt Sum 2"), Student B is the best candidate.
- For the engineering program ("Wt Sum 3"), Student C is the best candidate.
The geometry of weighted averages
You can plot the test scores as ordered pairs in two-dimensional space. The weight vector determines a line. The projection of the ordered pairs onto that line determines the ranking of the subjects. For example, the following graph shows the geometry for the weight vector w1=(1,0):
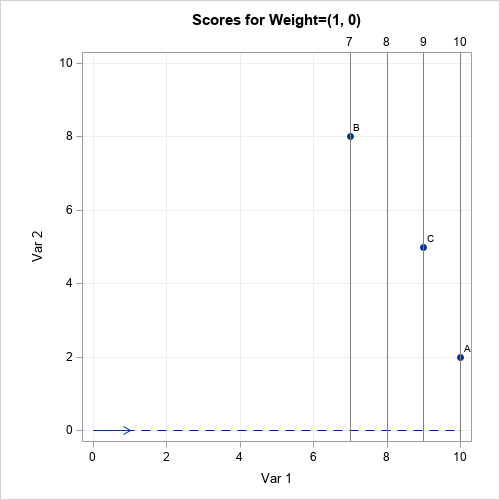
For this weight vector, the weighted sum is merely the first component. This is also the projection of the point onto the blue dashed line αw1, for any scalar value of α. The projections that are far from the origin have a larger weighted sum than the projections that are closer to the origin. The students' ranks are determined by their relative positions along the blue dashed line. For this example, Student A is the most highly ranked student (for the math department) because its projection onto the line is farthest from the origin. The gray lines indicate the projection onto the blue line. The gray lines are perpendicular to the blue line.
If you use a different weight vector, you might get a different result. The following graph shows the results for the same students but for the law-school weight vector w2=(1,1). Again, the students' ranks are determined by their relative positions along the blue dashed line. But this time, Student B is the most highly ranked student because its projection onto the line is farthest from the origin. The gray lines are perpendicular to the blue line and indicate the projection onto the blue line.
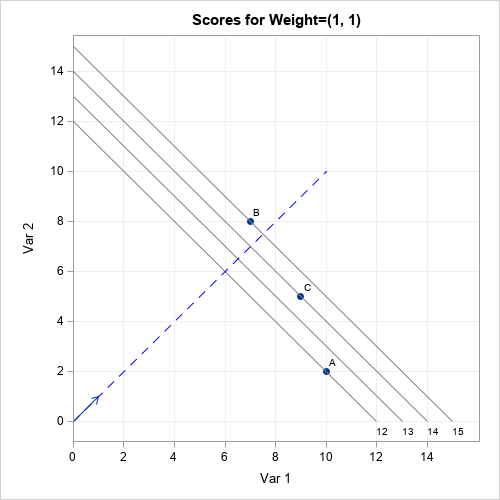
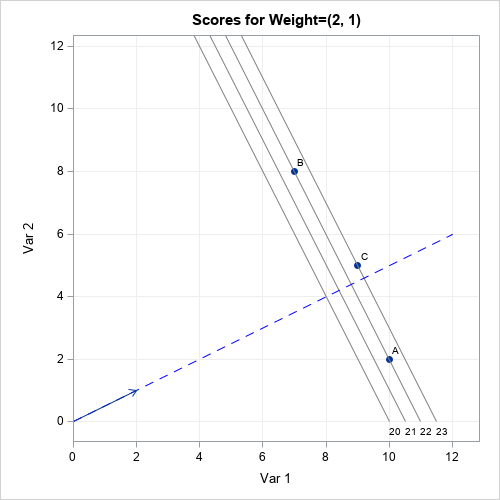
The ranks of the students change again if you consider the weights given by w3=(2,1). For these weights, Student C is the highest-ranked student by the engineering school. The graph is shown at the top of this article. Note that students A and B are assigned the same rank because they lie on the same gray line, which is perpendicular to the blue line. This can happen for any weight vector: If two students are on the same perpendicular line, their projection is the same.
Ranking by using additional variables
The geometry does not change much if you compute a weighted sum of more than two factors. For three factors, the weight vector determines a (blue dashed) line in 3-D space, and the scores are projected onto the line. In the 2-D examples, I drew gray lines perpendicular to the blue line. For three factors, the analogous structures are planes that are perpendicular to the blue line. All subjects on the same plane have the same ranking. In d dimensions, the planes become (d-1)-dimensional hyperplanes.
An important consideration for this process (in any dimension) is that the factors should be measured on comparable scales. In the earlier example, both standardized test scores were assumed to be measured on the same scale. However, you should standardize variables that are on different scales. For example, you would not want to use a weighted average of the median home price (possibly $300,000) and the mean annual temperature (possibly 15°C) without standardizing those quantities.
Summary
Sometimes rankings are based on a statistical model, but other times they are based on a "gut feeling" about which features are important. Magazines publish annual rankings of colleges, cities, hospitals, pizzas, and places to work. It is important to realize that the weights that are used for these rankings are somewhat arbitrary. Even if the weights are based on a survey, there is uncertainty in the weights.
This article shows that if you vary the weights, the rankings can change. This article discusses the geometry of weighted sums and averages. A weight vector determines a direction in a d-dimensional feature space. To rank subjects, you project d-dimensional tuples of points onto the line that is determined by the weight vector. The highest-ranked subject is the one that is farthest from the origin along the direction of the weight vector.
So next time you disagree with a ranking, you can confidently say to your friends, "Yes, but if they had used different weights, the results would have been different."
You can download the SAS program that creates the tables and graphs in this article.

3 Comments
Rick,
Principle Component Analysis is also a weighted averages. and be used to rank at some field .Next blog is about PCA for ranking ?
No, there are at least two problems with using PCA for this task:
1. The principal components are determined by the data. In particular, the first PC is the direction of maximal variation. For standardized variables. you might get a score such as 0.7*Test1 + 0.7*Test2. This might satisfy the law school, but it will not satisfy those who want to emphasize one test score more than the other.
2. A principal component can use negative coefficients to form the linear combinations, whereas weights are always positive. If Test1 and Test2 are negatively correlated, the PCA will give 0.7*Test1 - 0.7*Test2. The minus sign is not acceptable for a weight vector.
Pingback: A comparison of different weighting schemes for ranking sports teams - The DO Loop