Many nonparametric statistical methods use the ranks of observations to compute distribution-free statistics. In SAS, two procedures that use ranks are PROC NPAR1WAY and PROC CORR. Whereas the SPEARMAN option in PROC CORR (which computes rank correlation) uses only the "raw" tied ranks, PROC NPAR1WAY uses transformations of the ranks, called scores, to compute rank-based analysis of variance (ANOVA), empirical distribution tests, and other analyses. This article shows two things:
- How to generate normally distributed scores that have the same (rank) correlation as the original data.
- How these scores are computed if there are tied values in the data.
What is a "score" in statistics?
Statisticians like the word "score." As a verb, "to score" means to evaluate a regression model on one or more observations. As a noun, "raw score" means the original data. "Standardized score" (or z-score) implies that the data have been transformed according to a standardizing transformation. The "rank score" (or Wilcoxon score) is the result of replacing each observation by its rank. Other types of rank-based scores, often called normal scores, are explained in the documentation for PROC NPAR1WAY, including the Blom, Tukey, and van der Waerden scores.
Ranks and normal scores
You can use the NORMAL= option in PROC RANK to obtain three common rank-based normal scores.
The three scores are essentially the same and are can be used to construct normal Q-Q plots. Assume that the data do not have any duplicate values. Let
Ri be the rank of the i_th observation of a data vector, X. Then the normal scores have the form
si = Φ-1( (Ri−c) / (n+b) )
where Φ-1 is the inverse standard cumulative normal distribution, and n is the number of nonmissing observations.
- For Blom's score, c=3/8 and b=1/4
- For Tukey's score, c=1/3 and b=1/3
- For van der Waerden's score, c=0 and b=1
If the data have duplicate values, you need to adjust the formulas slightly, as shown in the last section of this article.
Why are normal scores useful?
The idea behind a normal score is rather clever. You compute the ranks of each variable and scale them so that they are in the range (0,1). You then compute the standard normal quantiles of these values. The resulting scores are often approximately normal.
Because the transformation includes a standardization, some statistics (such as the median and the interquartile range) are different between the data and the scores. However, the ranks of the scores are the same as the ranks of the original data, which means that many rank-based statistics are identical for the data and for the scores. This includes multivariate statistics such as the rank correlation between two variables.
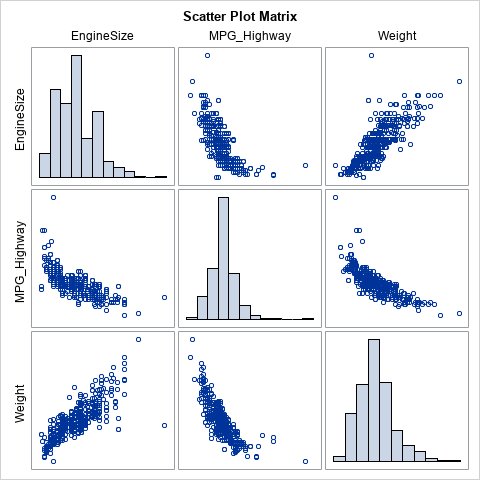
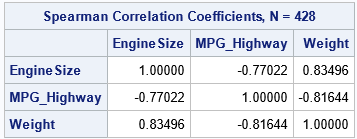
Let's compute an example. First, let's compute the rank correlation between three variables in the Sashelp.Cars data set. The variables are not normally distributed, as shown by the matrix of scatter plots and the marginal histograms:
proc corr data=Sashelp.Cars spearman nosimple noprob plots(maxpoints=none)=matrix(hist); var EngineSize MPG_Highway Weight; label EngineSize= MPG_Highway= Weight=; /* suppress labels */ run; |
You can use PROC RANK to create new variables that contain the normal scores for the variables. The NORMAL= option supports all three normal scores. For this example, I will use the van der Waerden scores (NORMAL=VW). The following statements generate the variables, then compute the rank correlation between the scores:
/* write VDW scores to RANKOUT data set */ proc rank data=Sashelp.Cars out=RankOut ties=mean normal=VW; var EngineSize MPG_Highway Weight; ranks vdwEngineSize vdwMPG_Highway vdwWeight; /* names of scores */ run; proc corr data=RankOut spearman nosimple noprob plots(maxpoints=none)=matrix(hist); var vdw:; label vdwEngineSize= vdwMPG_Highway= vdwWeight=; /* suppress labels */ run; |
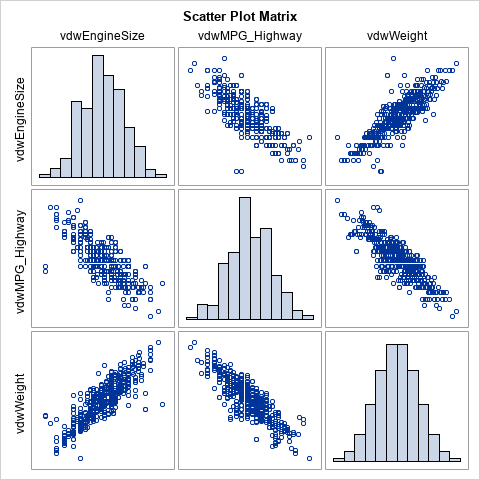
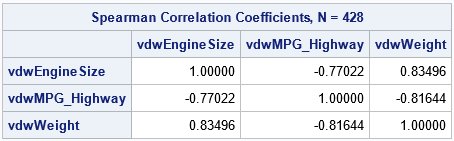
The rank correlations between the scores are exactly the same as for the original data. This is because the transformation between data and scores preserves the ranks. The scatter plot matrix of the scores shows that the scores are approximately multivariate normal. The bivariate scatter plots show the elliptical shapes that you would expect for correlated multivariate data.
This example shows the value of transforming data to scores. You get a new set of variables that are approximately multivariate normal and that have the same (rank) correlation as the original data. Although the Pearson product-moment correlation is not invariant under the transformation, the Pearson and Spearman correlations tend to be close to each other, so the Pearson correlation for the data tends to be close to the Spearman correlation for the scores.
Compute a normal score for tied values
As mentioned previously, when there are tied values, the transformation to produce the normal scores needs to be modified. You might guess that you should compute the tied ranks and then transformed the tied ranks into normal scores. However, both PROC NPAR1WAY and PROC RANK do something slightly different. The following quote is from the documentation for PROC NPAR1WAY:
When there are tied values, PROC NPAR1WAY first sorts the observations in ascending order and assigns ranks as if there were no ties. Then the procedure computes the scores based on these ranks by using the formula for the specified score type. The procedure averages the scores for tied observations and assigns this average score to each of the tied observations. Thus, all equal data values have the same score value.
The following SAS/IML program computes the van der Waerden scores for the three variables in the Sashelp.Cars data. First, the program computes the scores "incorrectly" by using the RANKTIE function to compute the averaged ranks and then transforming the tied ranks. Next, the program uses the method in the PROC NPAR1WAY documentation to compute the correct scores. Both methods are compared to the output from PROC RANK. The numerical difference between the incorrect-but-fast method and the correct-but-slower method is very small.
proc iml; /* read the original data */ varNames = {'EngineSize' 'MPG_Highway' 'Weight'}; use Sashelp.Cars; read all var varNames into Y; run; /* The simple method: If there are no ties, these statements transform the data into the van der Waerden scores. Assume Y does not have any missing values. */ n = nrow(Y); SimpleScores = j(n, ncol(Y), .); do i = 1 to ncol(Y); r = ranktie(Y[,i], "mean"); SimpleScores[,i] = quantile("Normal", r/(n+1)); end; /* read the scores from PROC RANK and compare */ use RankOut; read all var {'vdwEngineSize' 'vdwMPG_Highway' 'vdwWeight'} into VDW; close; maxDiffSimple = max(abs(SimpleScores-VDW)); /* If tied values, the computation is different and more complicated. */ start VDWTies(X); n = nrow(X); rank = rank(X); /* ignore ties */ q = quantile("Normal", rank/(n+1)); /* compute VDW scores */ score = j(n,1,.); uX = unique(X); /* get the distinct values */ do i = 1 to ncol(uX); /* for each distinct value */ idx = loc( X=uX[i] ); /* locate all ties for this value */ score[idx] = mean(q[idx]); /* average the scores */ end; return score; finish; scores = j(n, ncol(Y), .); do j = 1 to ncol(Y); scores[,j] = VDWTies(Y[,j]); end; maxDiff = max(abs(scores-VDW)); print maxDiffSimple maxDiff; |
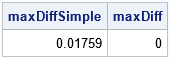
The simple application of the van der Waerden formula is slightly different from the PROC RANK output. To get the correct scores, you must average the scores of the tied values. In practice, you can often use the simpler transformation, especially for large samples and for variables that have only a small proportion of tied values.
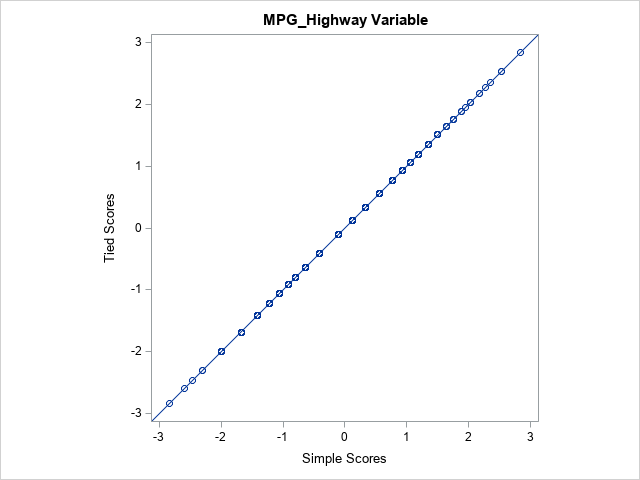
Even for moderate-sized samples (this example has 428 observations), the two methods tend to agree. For these data, the EngineSize variable has only 43 unique values. The MPG_Highway variable has only 33 unique values. Nevertheless, the simple computation of the van der Waerden scores is almost the same as the more complicated method that is used by PROC NPAR1WAY. A scatter plot of the two scores shows that the scores computed by the two methods are almost the same. The following statements create the scatter plot for the MPG_Highway variable:
title "MPG_Highway Variable"; call scatter(SimpleScores[,2], scores[,2]) procopt="noautolegend aspect=1" label={'Simple Scores' 'Tied Scores'} lineparm={0 0 1}; |
Summary
This article discusses rank-based normal scores, which are used in certain nonparametric tests. The scores are obtained by transforming the ranks of the original data. The scores have the same ranks as the data. Furthermore, the scores are approximately normally distributed, and they have the same rank correlation as the data.
This article also shows the correct way to compute the normal scores for tied values in the data. However, there is often little difference between the true scores and a simpler approximation that transforms the tied ranks.
