The ranks of a set of data values are used in many nonparametric statistics and statistical tests. When you request a statistic or nonparametric test in SAS, the procedure will automatically compute the ranks that are needed. However, sometimes it is useful to know how to compute the ranks yourself. This article shows how to compute ranks in SAS when the data contains repeated values, which result in tied ranks. The article shows how to use PROC RANK as well as the RANKTIE function in SAS/IML software.
What are tied ranks?
Ranks are easy to compute if there are no tied values in the data. You simply sort the data values and assign the ordinal position of the sorted data as the rank. For example, in the data {18, 13, 19, 16}, the corresponding ranks are {3, 1, 4, 2} because 13 is the first (sorted) value, 16 is the second (sorted) value, and so forth. For a sample of size n, the ranks are integers in the range [1,n].
When the data contains duplicate values, you must decide how to assign ranks to the tied values. All tied values should have the same rank, but what rank should you assign? There are several ways to handle ties, but the most common way is to assign the average rank of the tied values. This is advantageous in statistical tests because it preserves the sum of the ranks. For example, in the data {18, 13, 18, 16}, the "average rank" method would assign the ranks {3.5, 1, 3.5, 2} because the third and fourth sorted values are the same. Therefore, the average rank is (3 + 4)/2 = 3.5. Notice that the sum of the ranks is 10, which equals the sum of the integers 1:n, where n=4.
There are four common methods for handling ties. Suppose there are k tied values. If you sort the data, the tied values will appear in the ordinal positions R, R+1, ..., R+k-1.
- MEAN method: As discussed above, you can assign the rank of the tied values to be the mean position, which is (R + R+k-1)/2 = R + (k-1)/2.
- LOW or HIGH method: For the low method, the rank of the tied values is assigned to be R. For the high method, the rank of the tied values is assigned to be R+k-1.
- DENSE method: In the dense method, you first write down the set of unique data values. You then rank those unique values. For the original data, you assign each datum a rank that equals the rank of its unique value. For example, for the data {18, 13, 18, 16, 18, 16}, the unique values are {13, 16, 18}, which are assigned ranks {1, 2, 3}. Therefore, the ranks for the original data are {3, 1, 3, 2, 3, 2}.
In SAS, you can compute ranks by using the RANKTIE function in SAS/IML, or you can use PROC RANK in Base SAS. Both methods support the four methods for handling ties. The default method is the mean method.
Compute tied ranks in SAS/IML
You can use the RANKTIE function in PROC IML to compute tied ranks, as follows:
proc iml; x = {10, 10, 10, 11, 11, 12, 12, 12, 13}; rankMean = ranktie(x); /* default="MEAN" */ rankLow = ranktie(x, "Low"); rankDense = ranktie(x, "Dense"); print x rankMean rankLow rankDense; |
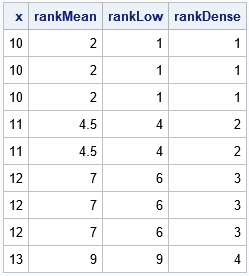
The result shows three of the four methods:
- MEAN method: The value 10 is the smallest value. In a sorted set, the value has the ordinal positions {1, 2, 3}. The average rank is therefore 2. Similarly, the (untied) ranks for the value 11 are {4, 5}, so the mean rank is 4.5.
- LOW method: This is the method used in sports. If three athletes all have the best score, we say they are tied for first. The next two athletes are tied for fourth place, and so on. The HIGH method is similar but isn't used as often in sports. For the HIGH method, we would say the three athletes that have the best scores are tied for third place. Both of these methods can be used to compute an empirical distribution function.
- DENSE method: There are four unique values, so the ranks are values 1, 2, 3, or 4.
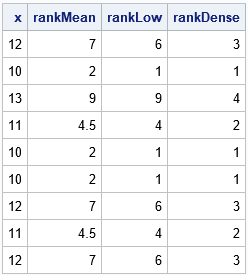
For simplicity, the previous example lists the data in sorted order. However, the tied ranks will be the same regardless of the order of the values. For example, the following statements use the same values but change the order of the observations. The ranks are the same:
/* Change the order of the data. The result is similar except for the ordering. */ x = {12, 10, 13, 11, 10, 10, 12, 11, 12}; rankMean = ranktie(x); /* default="MEAN" */ rankLow = ranktie(x, "Low"); rankDense = ranktie(x, "Dense"); print x rankMean rankLow rankDense; |
Compute tied ranks by using PROC RANK
Although PROC RANK supports the TIES= option to specify the MEAN, LOW, HIGH, or DENSE methods, you can only use one method at a time. Therefore, the following program calls PROC RANK three times and concatenates the outputs into a single data set:
data X; input x @@; datalines; 10 10 10 11 11 12 12 12 13 ; proc rank data=X out=rankMean ties=MEAN; var X; ranks rankMean; run; proc rank data=X out=rankLow ties=LOW; var X; ranks rankLow; run; proc rank data=X out=rankDense ties=DENSE; var X; ranks rankDense; run; data Ranks; merge rankMean rankLow rankDense; run; proc print data=Ranks; run; |
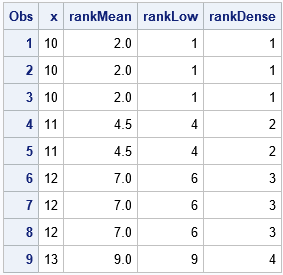
The result is the same as for the RANKTIE function in SAS/IML. In practice, you typically apply only one method for handling ties, so you only need to call PROC RANK once.
Summary
Many statistics and statistical tests use ranks. When the data contain duplicate values, the ranks are not unique. You must choose a way to assign ranks to the tied values. This article discusses four ways to compute tied ranks in SAS. Computations are shown by using PROC IML and PROC RANK.

5 Comments
Hi rick, yesterday posted on SGT ..but unable to find the thread here now . Hope to hear from you.
You posted to another article: https://blogs.sas.com/content/iml/2021/04/12/horizontal-bar-chart.html
If you want to ask a SAS programming question, you can post to the SAS Support Communities.
Pingback: Compute bivariate ranks - The DO Loop
Hi thanks for this post. I would be interested in how calculating ranks when having ties and censored samples in a dataset, e.g. for a dataset like this
3854 F
3854 F
4444 F
5000 S
5000 S
5000 S
5000 S
5000 S
5227 F
5683 F
7000 S
7000 S
Read the section "Compute tied ranks by using PROC RANK" in this article. If that doesn't solve your problem, post your question to the SAS Support Communities. There you can explain what you are trying to accomplish and also explain what the 'F' and 'S' values represent in your data.