Find an inflection point for a function numerically

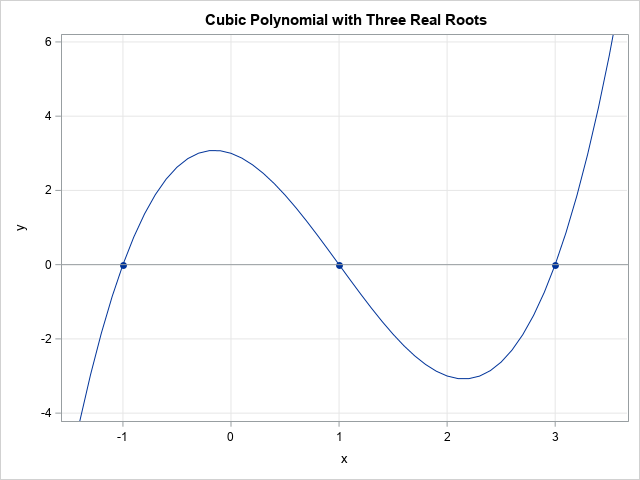
A SAS programmer asked if it is possible to numerically find an inflection point for a univariate function, f(x). Yes! This can be solved as a variation of a classic numerical root-finding problem. Recall that an inflection point is a value (call it x0) in the domain where the graph