Did you know that SAS can combine or "merge" a symbol and a line pattern into a single legend item, as shown below? This kind of legend is useful when you are overlaying a group of curves onto a scatter plot. It enables the reader to quickly associate values of a categorical variable with colors, line patterns, and marker symbols in a plot.
Legend items for marker/curve overlays
When you use PROC SGPLOT and the GROUP= option to create a graph, the SGPLOT procedure automatically displays the group attributes (such a symbol, color, and line pattern) in a legend. If you overlay multiple plot types (such as a series plot on a scatter plot) the default behavior is to create a legend for the first plot statement. You can use the KEYLEGEND statement to control which plots contribute to the legend. In the following example, the KEYLEGEND statement creates a legend that shows the attributes for the scatter plot (the marker shapes) and also the series plot (line patterns):
data ScatCurve; /* example data: scatter plot and curves */ call streaminit(1); do Group = 1 to 2; do x = 0 to 5 by 0.2; Pred = Group + (1/Group)*x - (0.2*x)**2; y = Pred + rand("Normal",0,0.5); output; end; end; run; ods graphics / antialias=on subpixel=on; title "Legend Not Merged"; proc sgplot data=ScatCurve; scatter x=x y=y / group=Group name="obs" markerattrs=(symbol=CircleFilled); series x=x y=Pred / group=Group name="curves"; keylegend "obs" "curves" / title="Group"; /* separate items for markers and lines */ run; |
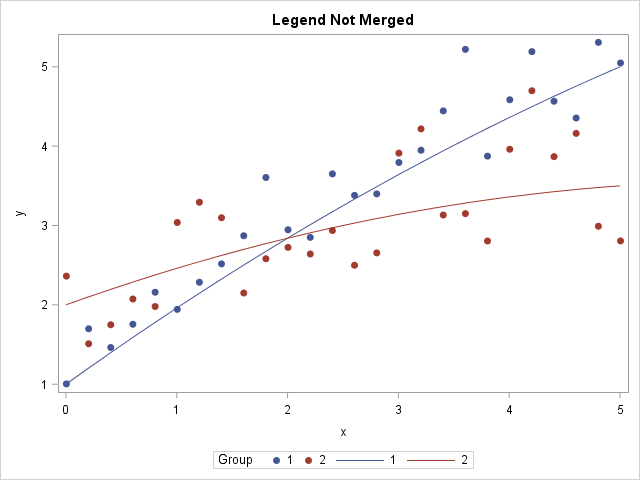
The legend contains all the relevant information about symbols, colors, and line patterns, but it is longer than it needs to be. When you display curves and markers for the same groups, you can obtain a more compact representation by merging the symbols and line patterns into a single legend, as shown in the next sections.
The MERGEDLEGEND statement in GTL
If you are comfortable with the Graph Template Language (GTL) in SAS, then you can use the MERGEDLEGEND statement to create a merged legend. The following statements create a graph template that overlays a scatter plot and a series plot and creates a merged legend in which each item contains both a symbol and a line pattern:
proc template; define statgraph ScatCurveLegend; dynamic _X _Y _Curve _Group _Title; /* dynamic variables */ begingraph; entrytitle _Title; layout overlay; scatterplot x=_X y=_Y / group=_Group name="obs" markerattrs=(symbol=CircleFilled); seriesplot x=_X y=_Curve / group=_Group name="curves"; /* specify exactly two names for the MERGEDLEGEND statement */ mergedlegend "obs" "curves" / border=true title=_Group; endlayout; endgraph; end; run; proc sgrender data=ScatCurve template=ScatCurveLegend; dynamic _Title="Overlay Curves, Merged Legend" _X="x" _Y="y" _Curve="Pred" _Group="Group"; run; |
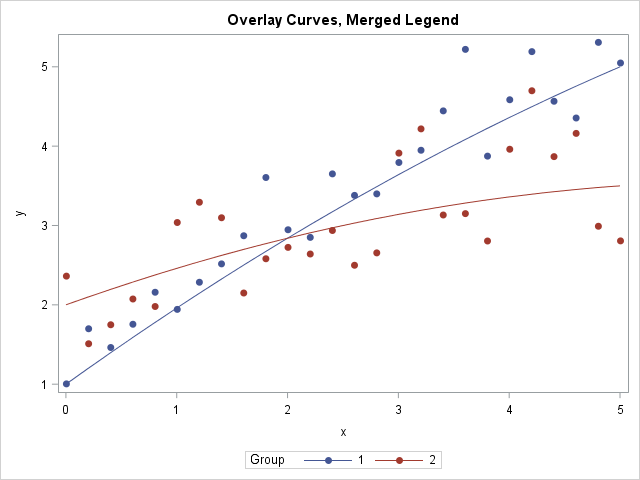
The graph is the same as before, but the legend is different. The MERGEDLEGEND statement is used in many graphs that are created by SAS regression procedures. As you can see, the legend shows the symbol and line pattern for each group.
The LEGENDITEM statement in PROC SGPLOT
Unfortunately, the MERGEDLEGEND statement is not supported by PROC SGPLOT. However, SAS 9.4M5 supports the LEGENDITEM statement in PROC SGPLOT. The LEGENDITEM statement enables you to construct a custom legend and gives you complete control over every item in a legend. The following example constructs a legend that uses the symbols, line patterns, and group values that are present in the graph. Notice that you have to specify these attributes manually, as shown in the following example:
title "Merged Legend by Using LEGENDITEM in SGPLOT"; proc sgplot data=ScatCurve; scatter x=x y=y / group=Group markeratters=(symbol=CircleFilled); series x=x y=Pred / group=Group; legenditem type=markerline name="I1" / label="1" lineattrs=GraphData1 markerattrs=GraphData1(symbol=CircleFilled); legenditem type=markerline name="I2" / label="2" lineattrs=GraphData2 markerattrs=GraphData2(symbol=CircleFilled); keylegend "I1" "I2" / title="Group"; run; |
The graph and legend are identical to the previous graph and are not shown.
The advantage of the LEGENDITEM statement is that you can layout the legend however you choose; the legend is not tied to the attributes in any previous graph component. However, this is also a disadvantage. If you change the marker attributes in the SCATTER statement, the legend will not reflect that change until you manually modify each LEGENDITEM statement. Although there is no denying the power of the LEGENDITEM statement, the MERGEDLEGEND statement in the GTL always faithfully and automatically reflects the attributes in the SCATTERPLOT and SERIESPLOT statements.
In summary, the SG procedures in SAS automatically create a legend. When you overlay multiple plots, you can use the KEYLEGEND statement to control which plots contribute to the legend. However, it is also possible to merge the symbols and line patterns into a single compact legend. In the GTL, you can use the MERGEDLEGEND statement. In SAS 9.4M5, PROC SGPLOT supports the LEGENDITEM statement to customize the items that appear in a legend.

3 Comments
SGPLOT does produce merged line and marker legend entries when using a SERIES plot with MARKERS option.
Pingback: 5 tips for customizing legends in PROC SGPLOT in SAS - The DO Loop
MARKERS option is the great way to combined the legend.