When a graph includes several markers or line styles, it is often useful to create a legend that explains the relationship between the data and the symbols, color, and line styles in the graph. The SGPLOT procedure does a good job of automatically creating and placing a legend for most graphs. However, sometimes it is useful to override the procedure's default choices. This article describes five tips that you can use to customize the content and placement of legends. The tips are:
- Suppress the legend by using the NOAUTOLEGEND option.
- Choose which components of the graph appear in the legend by using a KEYLEGEND statement and the NAME= option.
- Position the legend by using the LOCATION= and POSITION= option on the KEYLEGEND statement.
- Exclude one or more items from a legend by using the EXCLUDE= option on the KEYLEGEND statement (requires SAS 9.4M3).
- Consolidate one or more items by using the LEGENDITEM statement (requires SAS 9.4M5).
1. Suppress the legend
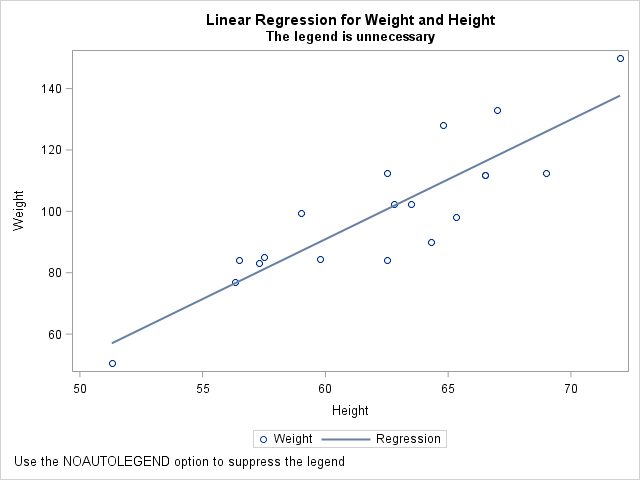
By default, the SGPLOT procedure displays a legend when there are multiple plots that are overlaid in the graph. This can be caused by multiple statements or by using the GROUP= option on a statement. If the information in the default legend is redundant, and you might want to suppress it. For example, the following legend is unnecessary because the title explains the data and the regression line. You can uncomment the NOAUTOLEGEND option to suppress the legend.
title "Linear Regression for Weight and Height"; title2 "The legend is unnecessary"; proc sgplot data=Sashelp.Class /* NOAUTOLEGEND */; scatter x=Height y=Weight; reg x=Height y=Weight / nomarkers; footnote J=L "Use the NOAUTOLEGEND option to suppress the legend"; run; footnote; |
2. Choose which components appear in the legend
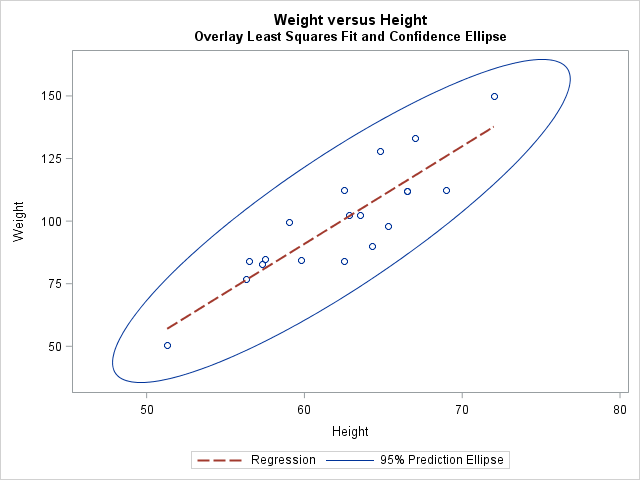
In some graphs that overlay multiple components, some components are self -explanatory and do not need to appear in the legend. You can choose which components appear in the legend by using the NAME= option on the statements and using the KEYLEGEND statement to specify the contents of the legend. For example, the following statements create a graph that consists of a scatter plot, a confidence ellipse, and a regression line. If you only want the confidence ellipse and regression line to appear in the legend, use the NAME= option to identify each component and use the KEYLEGEND statement to specify the contents of the legend:
title "Weight versus Height"; title2 "Overlay Least Squares Fit and Confidence Ellipse"; proc sgplot data=Sashelp.Class; scatter x=Height y=Weight / name="scatter"; ellipse x=Height y=Weight / name="ellipse"; reg x=Height y=Weight / name="reg" nomarkers lineattrs=GraphData2; keylegend "reg" "ellipse"; /* list item in the order you want them */ run; |
3. Position the legend
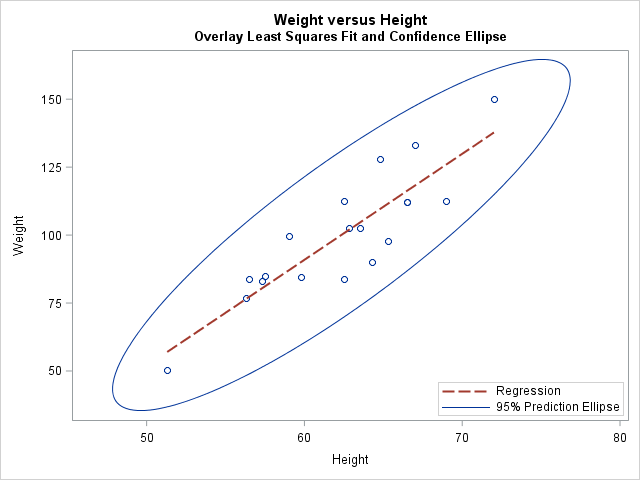
The KEYLEGEND statement supports the LOCATION= and POSTITION= options, which enable you to place the legend almost anywhere in the graph. The LOCATION= option controls whether the legend appears inside or outside of the graph area. The POSITION= option controls the placement of the legend on the graph (left, right, top, bottom,...). However, I can never remember which option controls which attribute! Therefore, I created a mnemonic, which I hope will help you remember, too:
- The LOCATION= option contains the substring 'CAT'. A CAT likes to go INSIDE and OUTSIDE the house. Therefore, the valid keywords for the LOCATION= option are INSIDE and OUTSIDE.
- The POSITION= option contains the substring 'SIT'. You can SIT on the LEFT or RIGHT side of a couch. (Also, "position" can be used as a verb to mean "place on a page.") Therefore, the valid keywords for the POSITION= option are BOTTOM, BOTTOMLEFT, BOTTOMRIGHT, LEFT, RIGHT, TOP, TOPLEFT, and TOPRIGHT. (Some other graphical elements support a CENTER position, but not the legend.)
The following graph is the same as in the previous example, except that the location of the legend is inside the graph area and the position of the legend is in the lower-right corner. When you move the legend to the left or right side of the graph, it is often useful to use the ACROSS=1 option to force the legend to list the items vertically. Similarly, if you position the legend at the top or bottom of a graph, you might want to use the DOWN=1 option to list the items horizontally.
keylegend "reg" "ellipse" / location=inside position=bottomright across=1; |
4. Exclude items from a legend
When you use the GROUP= option to display groups, you might want to exclude some of the group categories from the legend. The KEYLEGEND statement supports the EXCLUDE= option that you can use to exclude certain items. Three situations come to mind:
- The group levels contain missing values. You might want to exclude the missing values from the legend by using KEYLEGEND / EXCLUDE=(" ");.
- The purpose of the graph is to focus on one or two subgroups. If so, it might make sense to label only those groups. For example, if the purpose of a graph is to show income disparity between blacks and whites, you might decide not to include Asians or Hispanics in the legend: EXCLUDE=("Asian" "Hispanic");.
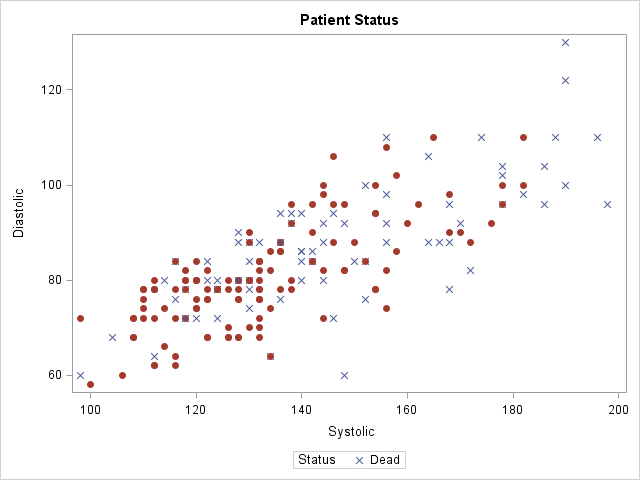
- The group is binary. If a graph shows the results of a clinical trial and the legend includes the marker shape for the patients who died, it should be clear that the other marker shape represents patients who survived: EXCLUDE=("Alive");. An example is shown below
ods graphics / attrpriority=none; title "Patient Status"; proc sgplot data=Sashelp.Heart(obs=200 where=(Systolic<=200)); styleattrs datasymbols=(X CircleFilled); scatter x=Systolic y=Diastolic / group=Status; keylegend / exclude=("Alive"); run; |
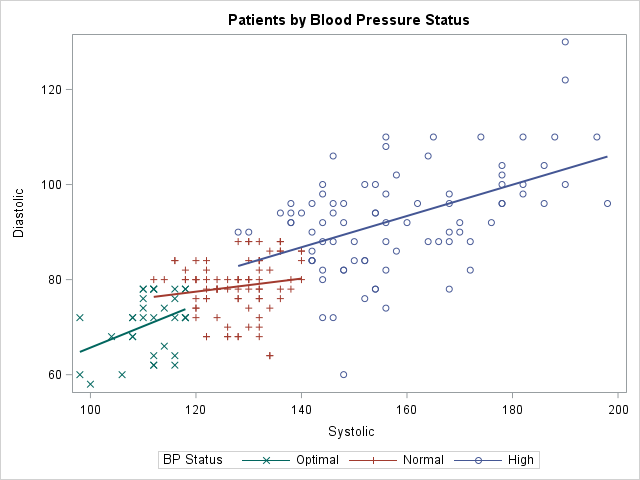
5. Customize items in a legend
The previous section shows how to exclude one or more levels in a categorical variable that is specified on the GROUP= option. You also might want to customize the items that appear in the legend in order to combine, for example, marker and line attributes. A situation where this comes up is when you want to overlay a group of curves on a scatter plot.
The LEGENDITEM statement (supported in SAS 9.4M5) enables you to specify what combination of markers and line patterns you want to appear for every item in a legend. It is a "super customization" statement that gives you complete control over the legend items.
The following statements show how to use the LEGENDITEM statement to create a customized legend. By default, if you use the REG statement with the GROUP= option, the legend will show only the colors and line patterns for the regression lines. In the following example, I have used the ATTRPRIORITY=NONE option to force the marker symbols to differ between groups. I want the legend to show not only the colors and patterns of the regression lines but also the marker symbols for each group:
/* ensure order of BP_Status is High, Normal, Optimal */ proc sort data=Sashelp.Heart(obs=200 where=(Systolic<=200)) out=Heart; by BP_Status; run; ods graphics / attrpriority=none; title "Patients by Blood Pressure Status"; proc sgplot data=Heart; styleattrs datalinepatterns=(solid) ; reg x=Systolic y=Diastolic / group=BP_Status; legenditem type=markerline name="H" / label="High" lineattrs=GraphData1 markerattrs=GraphData1; legenditem type=markerline name="N" / label="Normal" lineattrs=GraphData2 markerattrs=GraphData2; legenditem type=markerline name="O" / label="Optimal" lineattrs=GraphData3 markerattrs=GraphData3; keylegend "O" "N" "H" / title="BP Status"; run; |
In summary, PROC SGPLOT in SAS supports several ways to create, suppress, position, and customize the items in a legend. Do you have a favorite way to customize a legend in PROC SGPLOT? Leave a comment!
WANT MORE GREAT INSIGHTS MONTHLY? | SUBSCRIBE TO THE SAS TECH REPORT

4 Comments
Rick,
I really like your last example for several reasons.
ATTRPRIORITY=NONE along with STYLEATTRS DATALINEPATTERSN=(SOLID) is usually my favorite variation on attribute priority with grouped data.
As you point out, LEGENDITEM is new. Before it came along, we had a number of tricks like packing the legend title with additional legend information. This is so much better! You might use annotation or some other method to put something additional in a graph, and the default legend does not quite convey what you want. LEGENDITEM can be a big help.
Another important technique is available in attribute maps. Show='AttrMap' ensures that the legend appears in the order in which the values occur in the attribute map data set. Again, we resorted to trickery to achieve this in the old days.
Warren
Hi Rick,
The data is like
Name X Y
A 1 2
B 3 4
C 5 6 ...
Now if I use proc SGPLOT to produce a scatter I get a circle or cross or plus to indiate the scatter points on the XY plane.
But what if I want to get a scatter where at the point (1,2) 'A' is printed and at the point(3,4) 'B" is printed and so on.
Thanks
You can ask questions and post data to https://communities.sas.com/. They'll tell you to use the MARKERCHAR=Name option in the SCATTER statement, or use the TEXT statement, which provides more control.
Pingback: Top posts from The DO Loop in 2018 - The DO Loop