All Posts
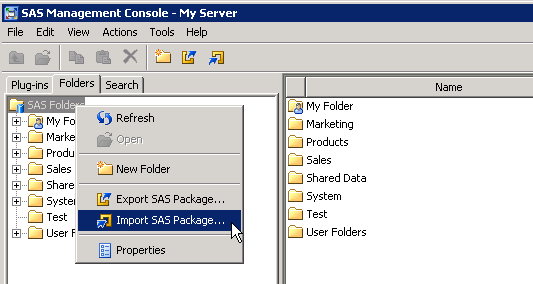

Let’s say that you are administering a SAS 9.4 environment that is working just fine. You’ve checked that your full backups are indeed happening and you’ve even tried restoring from one of your backups. You are prepared for anything, right? Well, I’d like to propose a scenario to you. You

It’s been quite an interesting Winter, one that was predicted by the Farmer’s Almanac to be cold and wet. Cold? Not so much. Wet? Painfully so! Parts of it have been beautiful, though, including an unexpected snow storm in January that covered our area in 10 – 12 inches of
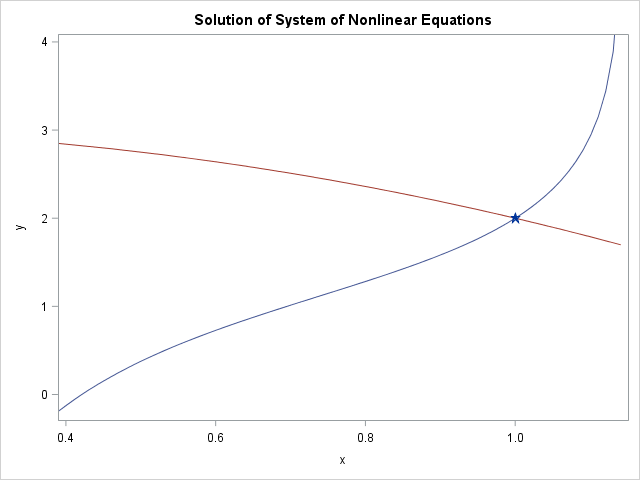

This article shows how to use SAS to solve a system of nonlinear equations. When there are n unknowns and n equations, this problem is equivalent to finding a multivariate root of a vector-valued function F(x) = 0 because you can always write the system as f1(x1, x2, ..., xn)


Part 5 of this series brings us to Rotterdam again, where I met with the two Notilyze founders Colin Nugteren and Tom Dogger. Both of them studied econometrics in Rotterdam, but go back as far as the F4 soccer team they were both playing in as kids. Company overview The


Goutam Chakraborty is a busy man. In addition to serving as SAS professor of marketing analytics at Oklahoma State University, Dr. Chakraborty is the director and founder of the SAS and Oklahoma State University MS in Business Analytics and an award winning author and professor. He teaches courses in such areas as business
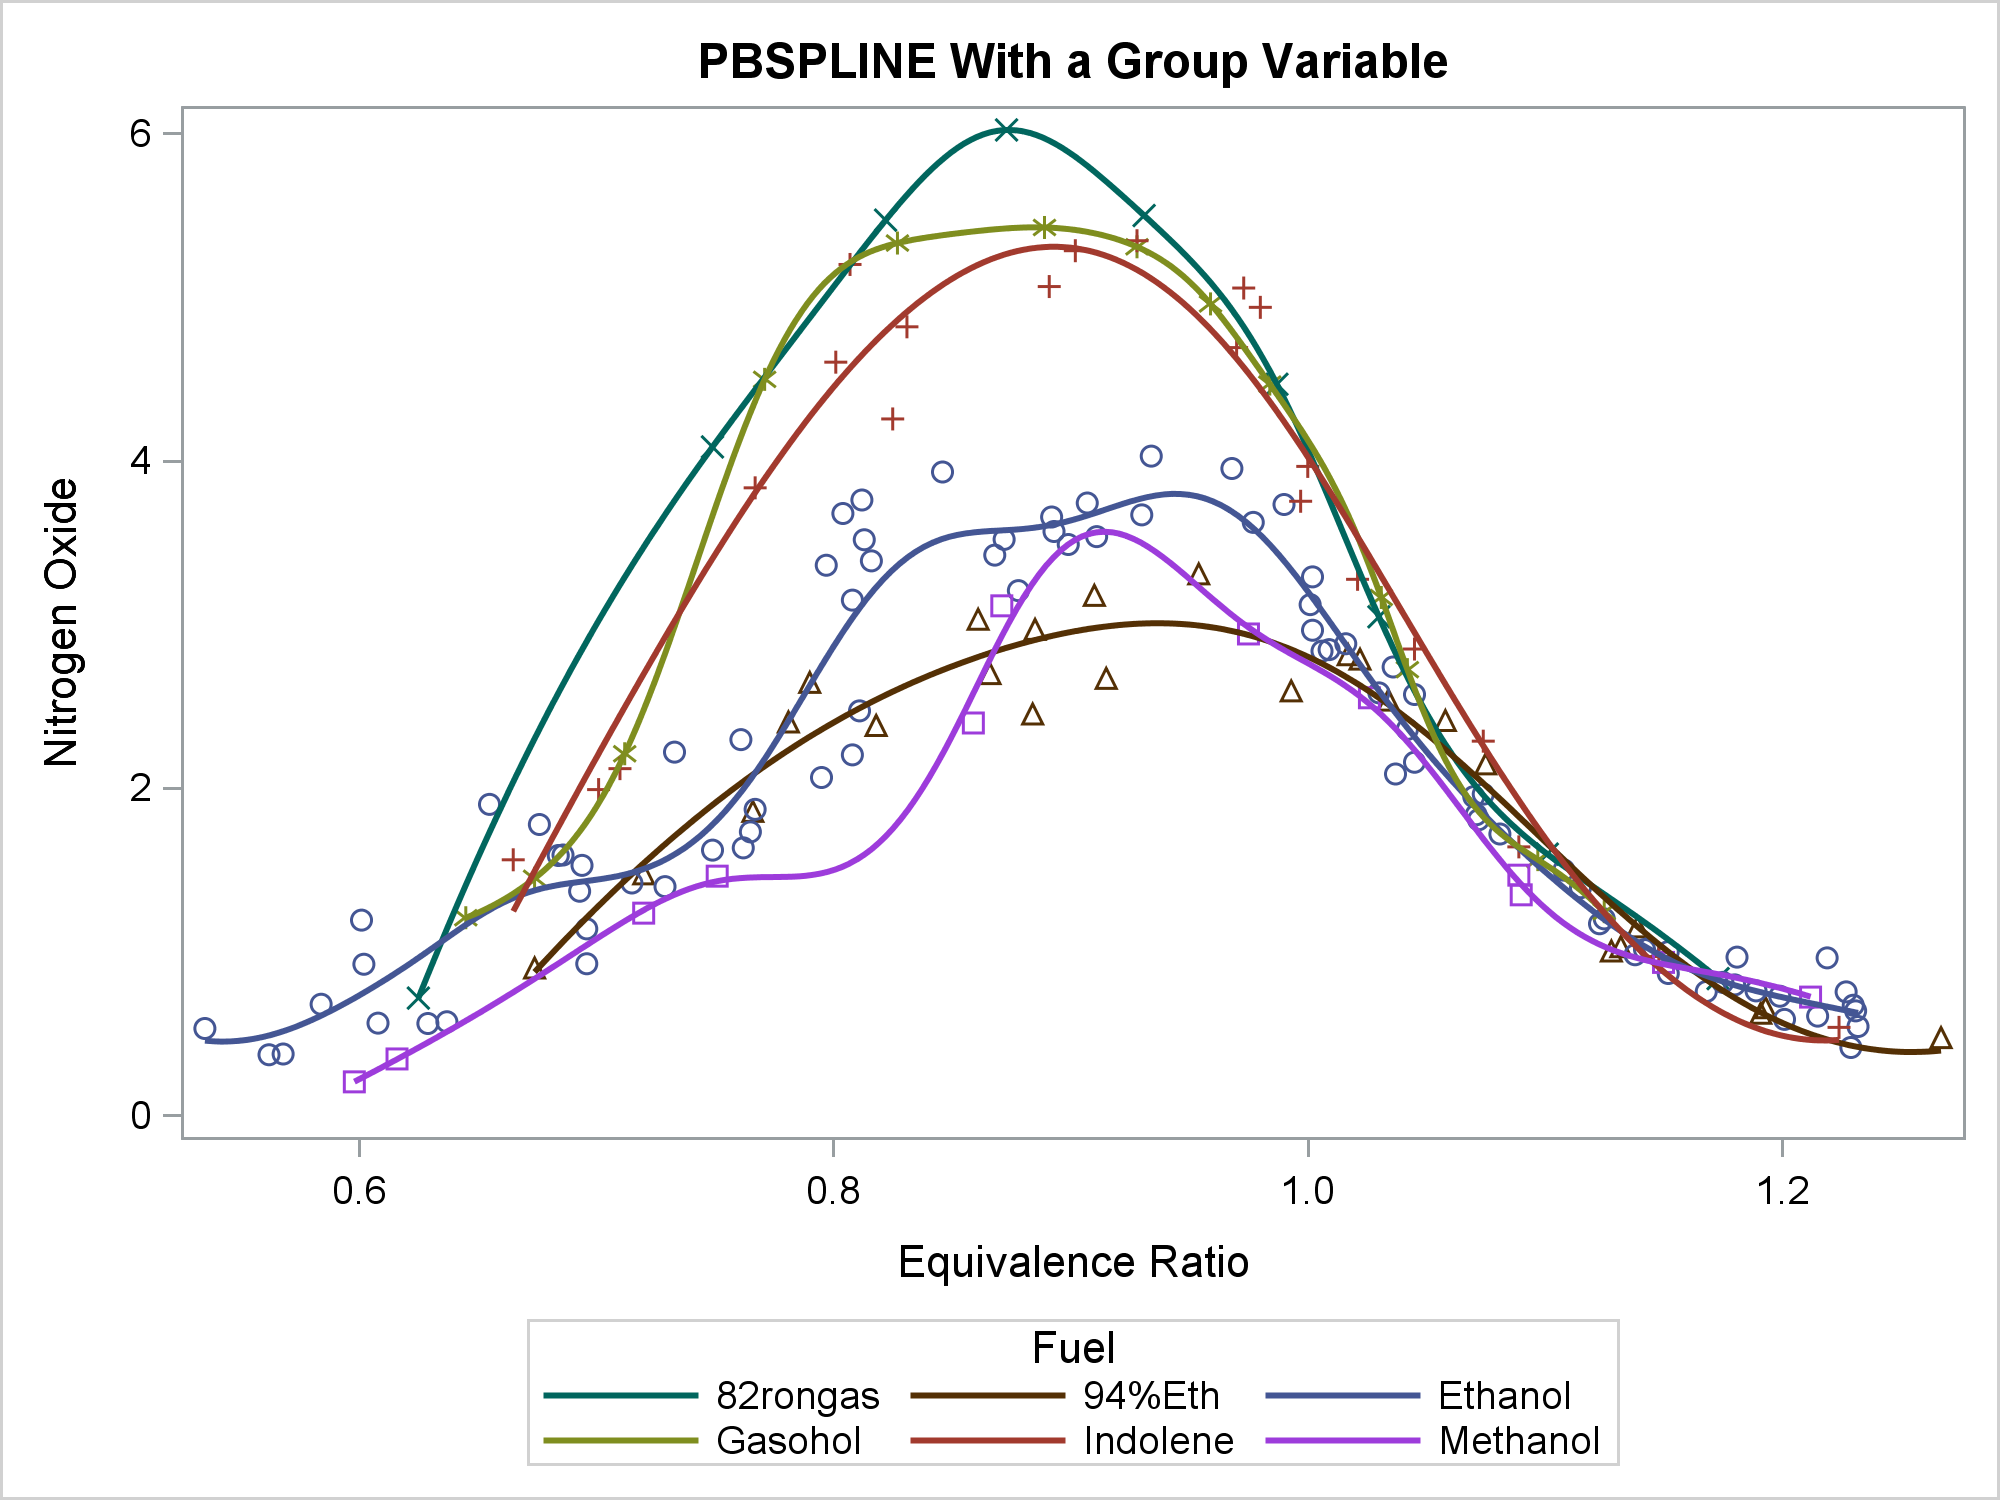

You can use penalized B-splines display a smooth curve through a set of data. The PBSPLINE statement fits spline models, displays the fit function(s), and optionally displays the data values.


Chess has been intertwined with Computer Science since, well ... forever. Long before supercomputer Deep Blue, loaded with human-crafted chess algorithms, beat reigning world champion Garry Kasparov in 1997. Well before AlphaZero AI defeated all of human chess knowledge with just a few hours of study. Way before computers even


La información genómica, las pruebas clínicas, los expedientes médicos electrónicos, los estudios de investigación y los resultados de las investigaciones pueden derivar en descubrimientos relevantes y apoyar a las autoridades sanitarias para tomar mejores decisiones. Como muchas otras disciplinas tecnológicas, la analítica se está aprovechando para hacer frente a las


I remember going to a workshop about grief a few years back. At one point, the speaker talked about various types of support grieving folks need after the typical mourning rituals have receded and life continues on. He asked the workshop participants to pull out a sheet of paper and


Los insights de los clientes probablemente sean el instrumento más efectivo para lograr el awareness que desea una marca. Según Gartner, “solo el 23% de las compañías son capaces de integrar insights de clientes en sus operaciones”. Un cliente satisfecho comparte en promedio con 6 personas sus experiencias de compra,


“Quick response forecasting (QRF) techniques are forecasting processes that can incorporate information quickly enough to act upon by agile supply chains” explained Dr. Larry Lapide, in a recent Journal of Business Forecasting column. The concept of QRF is based on updating demand forecasts to reflect real and rapid changes in demand, both


데이터 시각화 툴을 이용해 건물 지도, 층 설계, 기타 Esri 데이터를 디스플레이해야 한다면? 여기를 주목해주세요! 최근 ‘SAS 비주얼 애널리틱스 8.2(SAS Visual Analytics 8.2)’에 추가된 사용자 정의 폴리곤(polygon) 기능으로 여러 유형의 지역 오버레이를 렌더링할 수 있습니다. 일반적으로 보고서에 층 또는 건물 지도를 포함시킬 때 많이 사용되는데요. 오늘은 SAS 비주얼 애널리틱스로 실제 폴리곤을 등록하고,

My article about the difference between CLASS variables and BY variables in SAS focused on SAS analytical procedures. However, the BY statement is also useful in the SAS DATA step where it is used to merge data sets and to analyze data at the group level. When you use the
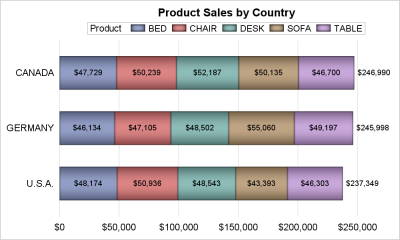

A common request on the communities page is to place data labels on horizontal bar charts. Often users want to display stacked horizontal bar charts, with the values displayed for each segment and the overall value of the bar itself as shown in the example below. In this example, the
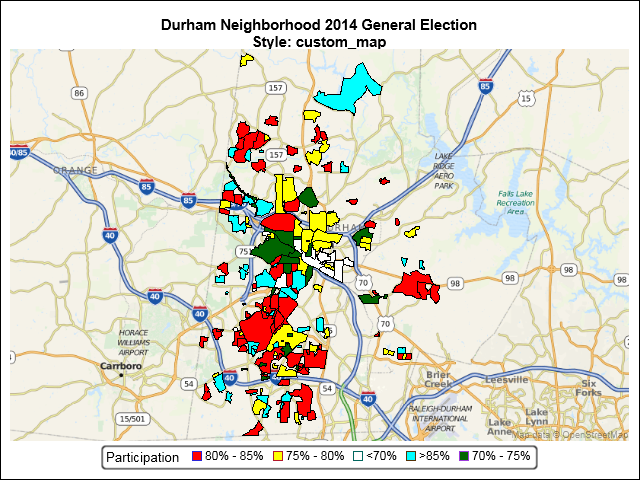

An earlier SGMAP blog used the BUBBLE statement to overlay point data on top of an Open Street Map. However, not all map features are points. Some are enclosed areas called polygons. Some map polygons share common borders such as states and counties. Others are separate, non-contiguous regions such as national parks