At SAS, we sometimes joke about not using analytics to help us accomplish some of our day to day tasks: “it’s a shame we don’t know someone that has some software for that!” In truth, though, we use data to accomplish a lot, and it has even been used to help author a new SAS book. I’m not talking Artificial Intelligence here, and no, we don’t have a robot in a basement somewhere churning out SAS Press titles. But recently, Zencos Data Visualization Practice Director, Tricia Aanderud, decided to let the data drive the content for her latest SAS book.
When community manager Anna Brown, saw Tricia’s SAS Global Forum paper last year, SAS® Visual Analytics Tricks We Learned from Reading Hundreds of SAS® Community Posts, she had to smile. The theme was a community manager’s dream come true: Tricia and her team had dissected SAS Communities posts and cross-reviewed ideas with community members to write a book of SAS Visual Analytics tips and tricks called, An Introduction to SAS® Visual Analytics: How to Explore Numbers, Design Reports, and Gain Insight into Your Data.
As Anna writes in her community post, the effort stands out as a quintessential example of what a true community can accomplish, and she was dying to ask Tricia how she did it. Tricia explained how community members “pressed the team to explain basics” and “reminded [her] that Australia and Europe also exist.”
Tricia realized that although many people start using SAS Visual Analytics they don’t understand data visualization principles, and can produce ineffective reports and analysis. In her experience, with even a little education, you can turn boring into effective and drab into dynamic. Along with her co-authors, Ryan Kumpfmiller and Rob Collum, she wanted to provide a common sense guide for using SAS Visual Analytics with some guidance from data visualization experts and some information for administrators.
Having worked with the product for several years she was already aware of some areas where users get stuck, but she was sure there were more. SAS Communities provided an excellent resource. Tricia and her team used SAS to apply some data analytics, for example, which posts had the most views and most comments. She then used that as the basis for deciding which questions were more important or perplexing for the user base. Then she looked for themes in the posts. They worked through the data to determine where in the book they would try to incorporate explanations and examples. In her own words, “It makes more sense to present a resolution to an issue when you know how and why users have actually faced the issue.”
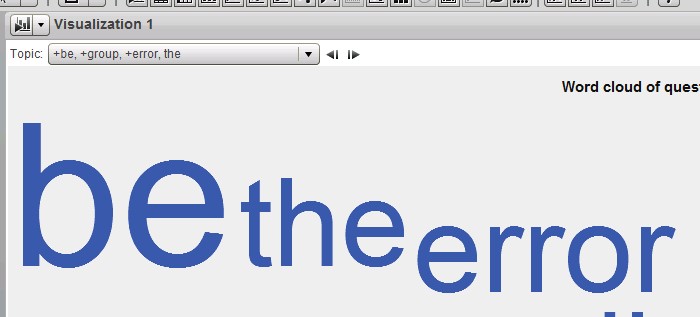
Be the Error
After writing most of the chapters, they gathered additional data from the SAS Communities and made one last pass-through to make sure they had the most-discussed topics. From this data, she generated a SAS Visual Analytics word cloud object and received a very Zen message!
Two technical reviewers for the book were selected based on their roles in the community. They provided excellent feedback to users and the authors during the review cycles, and really helped further develop the book. SAS employees were also active in answering questions, which was a great resource, especially since a new version of SAS Visual Analytics was about to be released.
But back to the data, in the book there is an entire data-driven chapter that goes through each data object and explains how to use that object. For each object one or two tips based on the top community questions were included. Using the analysis of the data to see what community members had the most difficulty with, enabled the authors to pinpoint topics that would be the most useful for users, and to try out ideas and examples on the audience. It was also a great way to let the community know about the forthcoming book and generate a lot of interest and excitement. It is probably no coincidence that the book was one of the best sellers at last year’s SAS Global Forum and continues to sit in the top ten.
And as a final take-away – “Be the error” but use the data!


2 Comments
A fabulous resource for SAS Visual Analytics users. It was a pleasure being a reviewer and I hope other readers enjoy the book as much as I did. Love that my feedback was entwined in the tips on Page 42. Let me know if you spot it! Thanks Tricia ;-)
We had so much fun writing the book and presenting at #SASGF!
Thanks Sian.