All Posts
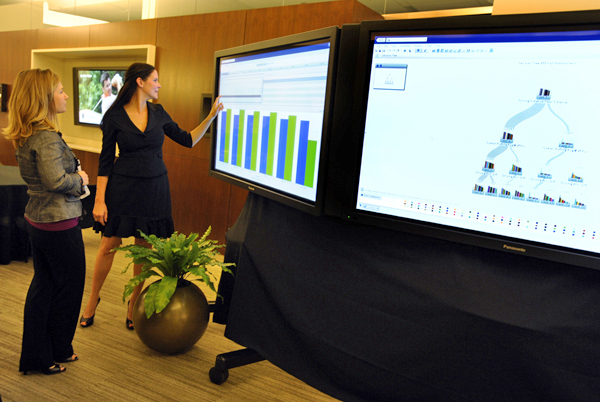

Being the Graph Guy, I wanted to know about all the "data visualization" presentations at the upcoming SAS Global Forum 2018 conference. I tried going through the official interface to search for such sessions, but it was difficult (impossible?) to know that I had found them all. Therefore I created

When speed is required at scale, it's hard to beat parallel processing data in memory with DS2 and SAS® Viya® with the amazing Cloud Analytic Services (CAS)!
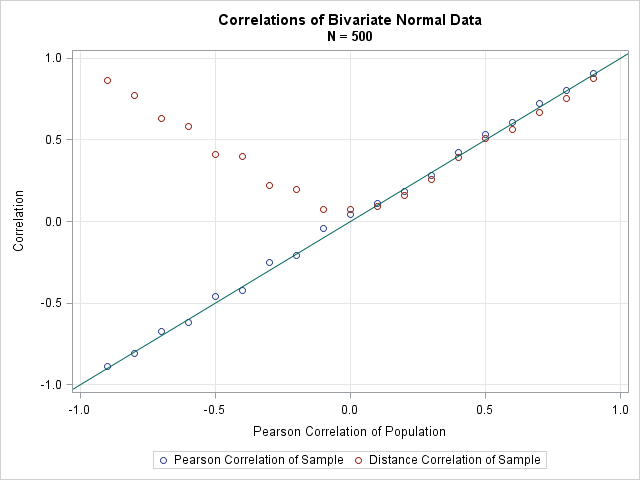

Correlation is a statistic that measures how closely two variables are related to each other. The most popular definition of correlation is the Pearson product-moment correlation, which is a measurement of the linear relationship between two variables. Many textbooks stress the linear nature of the Pearson correlation and emphasize that


El uso del análisis de datos trae resultados impactantes a los equipos de fútbol, que ahora ven a la analítica como una ficha clave en la toma de decisiones. En los últimos años, la tecnología se ha convertido en el director técnico de los equipos deportivos, pues resulta ser un


I love to walk. It takes just a couple of minutes and I am completely immersed in all the beauty that nature has to offer. Here in North Carolina we’re currently enjoying the flowering magnolia and cherry trees, the last of the daffodils, tulips that began to open just a


I have 3 mantras: less is more; you must start the way you want to finish; and, life is short but wide. As many of you know, I’m a planner. I’ve had my funeral folder since I was 19. Even with my good genes (my 98 year old father is


In the extended enterprise, data integration challenges abound. David Loshin explains.
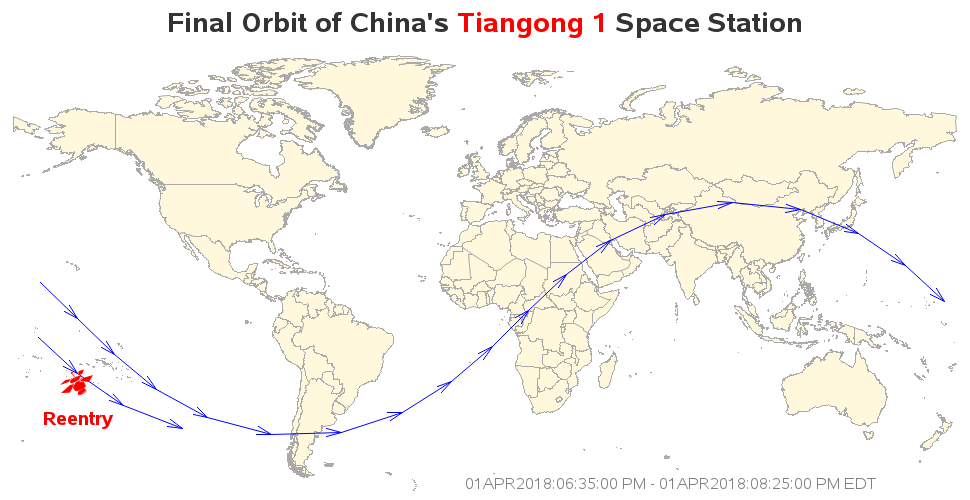
If you grew up as a space-junkie kid like me, then you've probably been watching the news for the past few days, wondering when and where China's Tiangong 1 space station was going to fall out of orbit, and crash to Earth. According to Popular Mechanics (PM), that happened at 8:16pm

As a general rule, when SAS programmers want to manipulate data row by row, they reach for the SAS DATA step. When the computation requires column statistics, the SQL procedure is also useful. When both row and column operations are required, the SAS/IML language is a powerful addition to a


Inspired by curiosity and backed by the most powerful analytics in the world, SAS discovers a new planet in our Solar system. See how we used SAS Viya to make this historic discovery.


Gradient boosting is one of the most widely used machine learning models in practice. See how to use gradient boosting model for classification in SAS Visual Data Mining and Machine Learning.
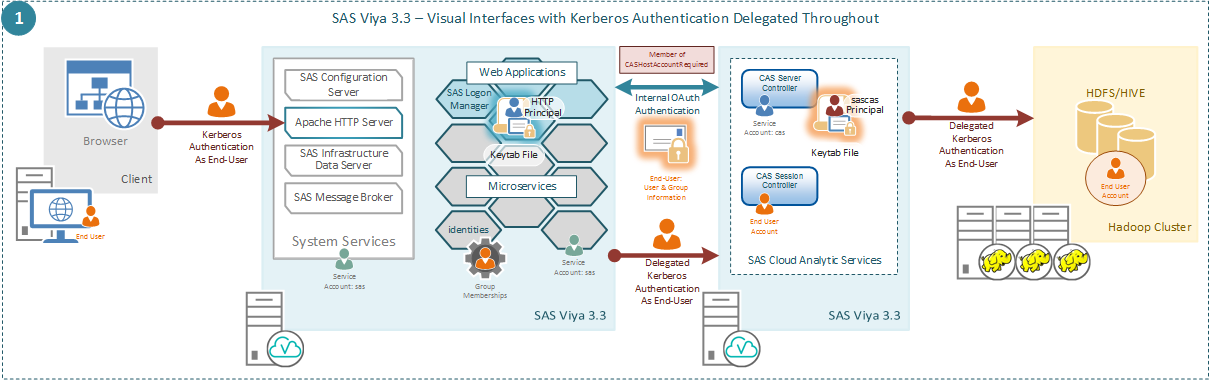

Learn about the new feature of SAS Viya 3.3 that enables Kerberos delegation throughout the environment. It allows you to have end-user sessions in SAS Cloud Analytics Services that are able to use Kerberos to connect to Secured Hadoop.
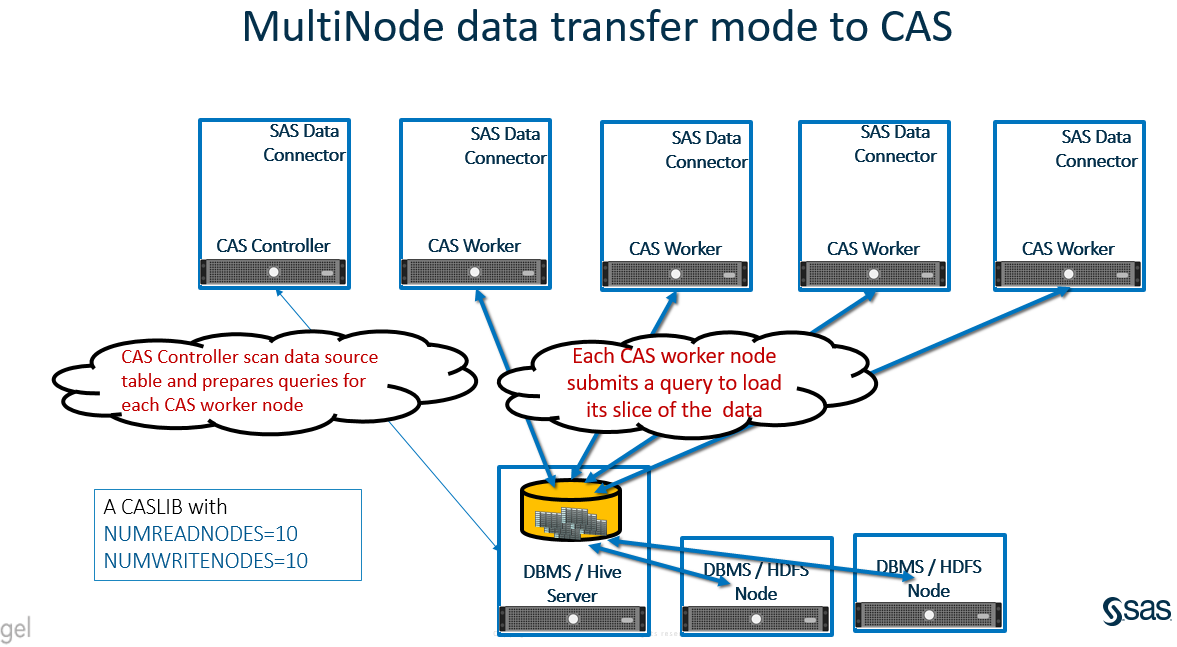

With SAS Viya 3.3, a new data transfer mechanism Multi Node Data Transfer has been introduced to transfer data between the data source and the SAS’ Cloud Analytics Services. Learn more about this feature.


SAS product manager, author and community contributor Gerhard Svolba shares 10 reasons to look forward to SAS Global Forum 2018.
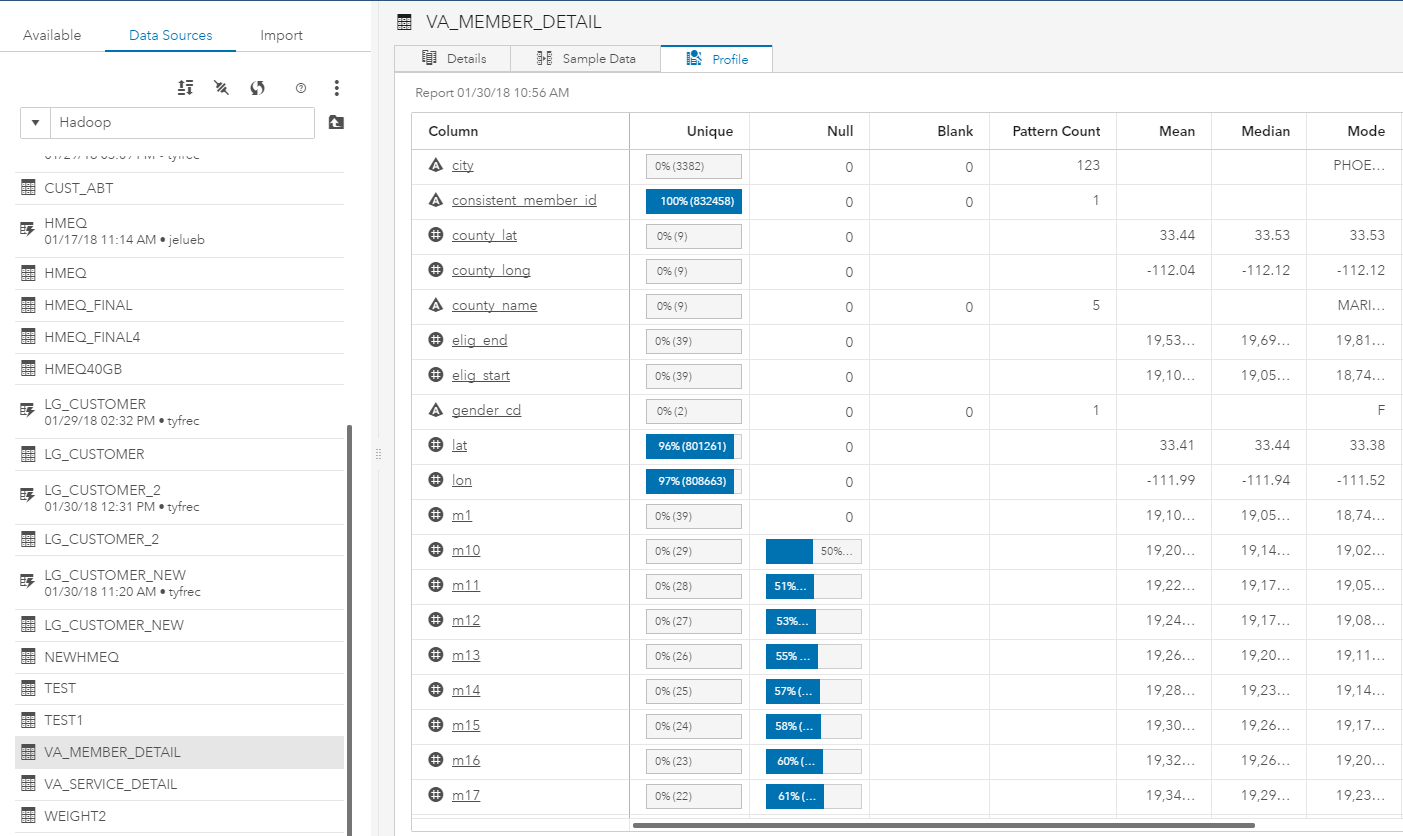

With the release of SAS Viya 3.3, you now have the ability to pass implicit SQL queries to a variety of SQL data sources, including Hive. Here's what happens as users write SAS compliant SQL code.