Gradient boosting is one of the most widely used machine learning models in practice, with more and more people like to use it in Kaggle competitions. Are you interested in seeing how to use gradient boosting model for classification in SAS Visual Data Mining and Machine Learning? Here I play with the classification of Fisher’s Iris flower dataset using gradient boosting, and this may serve as a start point to those interested in trying the classification models in SAS Visual Data Mining and Machine Learning product.
Fisher’s Iris data is a well-known dataset in data mining. Per Wikipedia, Fisher developed a linear discriminant model to distinguish the species from each other by the features provided in the dataset. You may already see people run different classification models on this dataset, such as neural network. What I am interested in, is to see how well SAS gradient boosting model will do the species classification.
#1 Explore the dataset
We can easily load Fisher’s Iris dataset from SASHelp.Iris into SAS Viya. The dataset consists of 50 samples each species of Iris Setosa, Virginica and Versicolor, totally 150 records with five attributes: Petal Length, Petal Width, Sepal Length, Sepal width and Iris Species. The dataset itself is already well-formed, with neither missing values, nor outliers. Take a quick look of the dataset in SAS Visual Analytics as below.
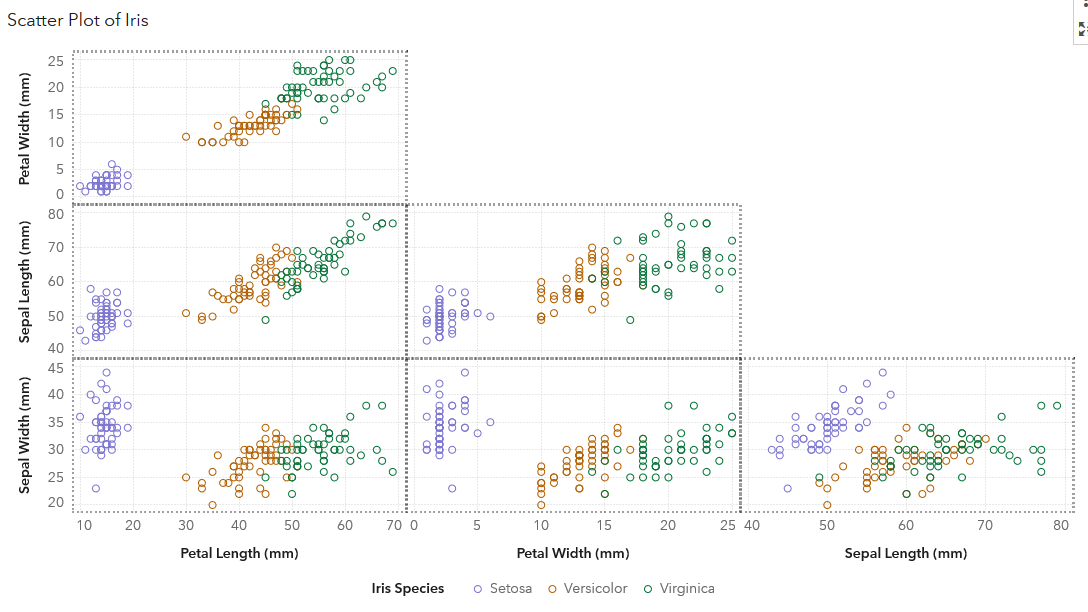
From the chart, we see that the iris species of ‘Setosa’ can be easily distinguished from the ‘Versicolor’ and ‘Virginica’ species by the length and width of their petals and sepals. However, this is not the case for the latter two species, some of them are staggered closely, which makes it a little hard to distinguish each other by these features.
#2 Prepare Data
There is not much effort needed to prepare the data for the prediction. But one thing I’d like to mention here is about the standardization of measure variables. By viewing the measure details in SAS Visual Analytics, we see that neither Petal Length distribution nor Petal Width distribution is normal. You may wonder if we need to normalize the data before applying it to the model for analysis, but this leads to one great thing I like the Gradient Boosting model. Users do not need to explicitly standardize quantitative data. Tree-base models should be robust to such problem in an input feature, since the algorithm is based on node splits. (Here is an article discussing a similar problem.)
So, here my data preparation is just doing the data partitioning before starting the classification on iris species. I need to make sure each partition will follow the same distribution on different species in the iris dataset. This can be achieved easily in SAS Visual Analytics by adding a partition data item - by setting the Sampling method to ‘Stratified sampling’ and add the ‘Iris Species’ as the column to be stratified by. I define two partitions so I have training partition, validation partition. I set 60% for training, and 40% for validation partition, with random seed 1234. Thus, a categorical data item ‘Partition’ is added, with value of 0 for validation, 1 for training partition. (For easier understanding in the charts, I’ve created a custom category called ‘Partitions’ based on the ‘Partition’ data item values.)
The charts below show that the 150 rows in Fisher’s Iris dataset are distributed equally into three species, and the created partitions are sampled with the same percentage among the three species.

#3 Train the gradient boosting model
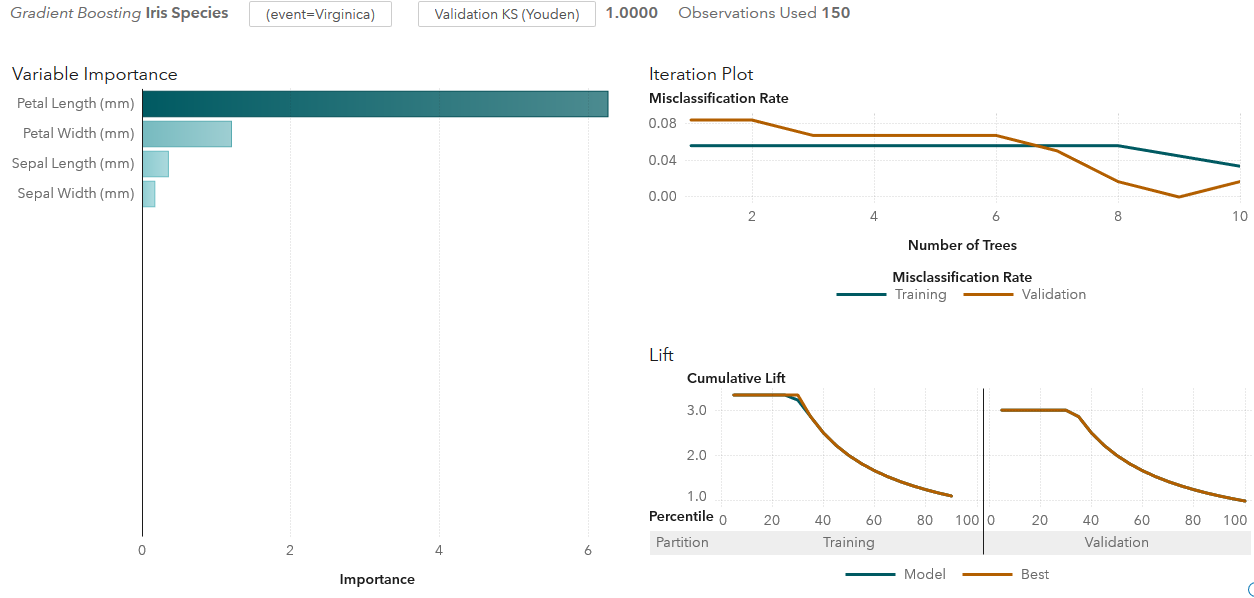
Training various models in SAS Visual Data Mining and Machine Learning allows us to appreciate the advantages of visualization, and it’s very straight-forward for users. In ‘Objects’ tab, drag and drop the ‘Gradient Boosting’ to the canvas. Assign the ‘Iris Species’ as response variable, and ‘Petal Length, Petal Width, Sepal Length, Sepal width’ as predictors. Then set the ‘Partition’ data item for Partition ID. After that, the system will train the model and show the model assessment. I’ve taken a screenshot for ‘Virginica’ event as below.
The response variable of Iris Species has three event levels – ‘Setosa’, ‘Versicolor’ and ‘Virginica’, and we can choose desired event level to have a look of the model output. In addition, we may switch the assessment plot of Lift to ROC plot, or to Misclassification plot (Note: the misclassification plot is based on event level, thus it will show the ‘Setosa’ and ‘NOT Setosa’ species if we choose the ‘Setosa’ event.). Below is a screenshot with ROC plot and the model assessment statistics.

In practice, training models usually cost a lot of effort in tuning model parameters. SAS Visual Data Mining and Machine Learning has provided the ‘Autotune’ feature that can help this, users may decide some settings like maximum iterations, seconds, and evaluations and the product will choose the optimal values for the hyperparameters of the model. Considering that this dataset only has 150 samples, I won’t bother to do the hyperparameters tuning.
#4 Make prediction by the model
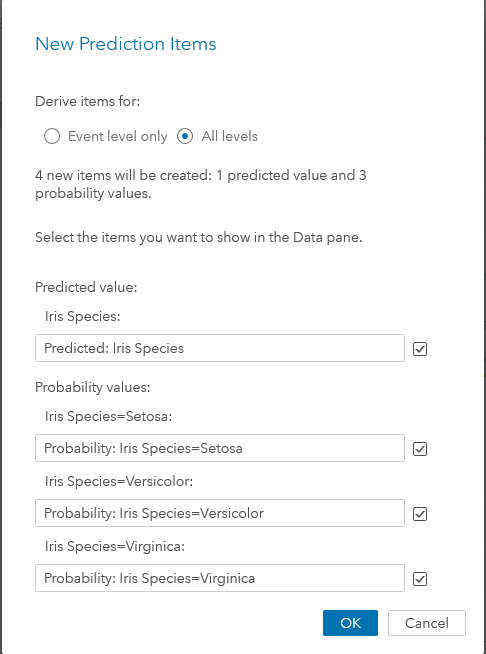
Now I can start to make predictions from the gradient boosting model for the data in testing partition. There are several ways to go here. In Visual Data Mining and Machine Learning, on the right-button mouse menu, either click the ‘Export model…’ or click the ‘Derive predicted…’ menu. The first one will export the model codes, so you can run it in SAS Studio with your data to be predicted. The latter one is very straight-forward in SAS Visual Data Mining and Machine Learning. It will pop up the ‘New Prediction Items’ page, where you may choose to get the predicted value and its probability values for all the levels of Iris Species. These data items will be added to the iris CAS table for further evaluation. Since the iris dataset has three species in the sample, I need to set ‘All levels’ so the prediction will give out the classification in three species and their probabilities.
#5 Review the prediction result
In the model assessment tab, we already see the model assessment statistics for model evaluation. We may also switch to ‘Variable Importance’ tab, or ‘Lift’ tab, ‘ROC’ tab, and ‘Misclassification’ tab to see more about the model. Here I’d like to visually compare the predicted species value with the iris species value provided in the dataset.
To show how many failures of the classification visually, I perform following actions:
- In SAS Visual Analytics, create a list table to show all 150 rows of the iris dataset. Since there is no primary key in the dataset, the SAS Visual Analytics list table will do aggregation for measure variables by default, so be sure to set the ‘Detail data’ option in the Options tab.
- Create a calculated item (named ‘equals’) to compare if the values of ‘Iris Species’ and ‘Predicted: Iris Species’ columns are equal: {IF ( 'Iris Species'n = 'Predicted: Iris Species'n ) RETURN 1 ELSE 0. }
- Define a display rule with the calculated item to highlight the misclassified rows. I’ve sorted the table by above ‘equals’ value so those rows without equal value of ‘Iris Species’ and ‘Predicted : Iris Species’ columns are shown on top.
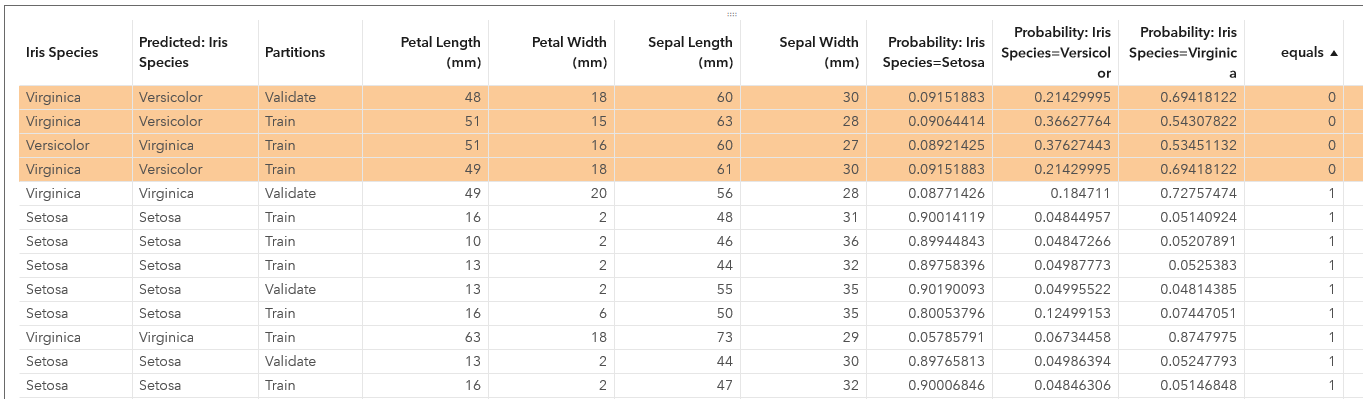
We see four rows are misclassified by the model, 3 of them are from training partition and 1 from validation partition. So far, the result looks not bad, right?
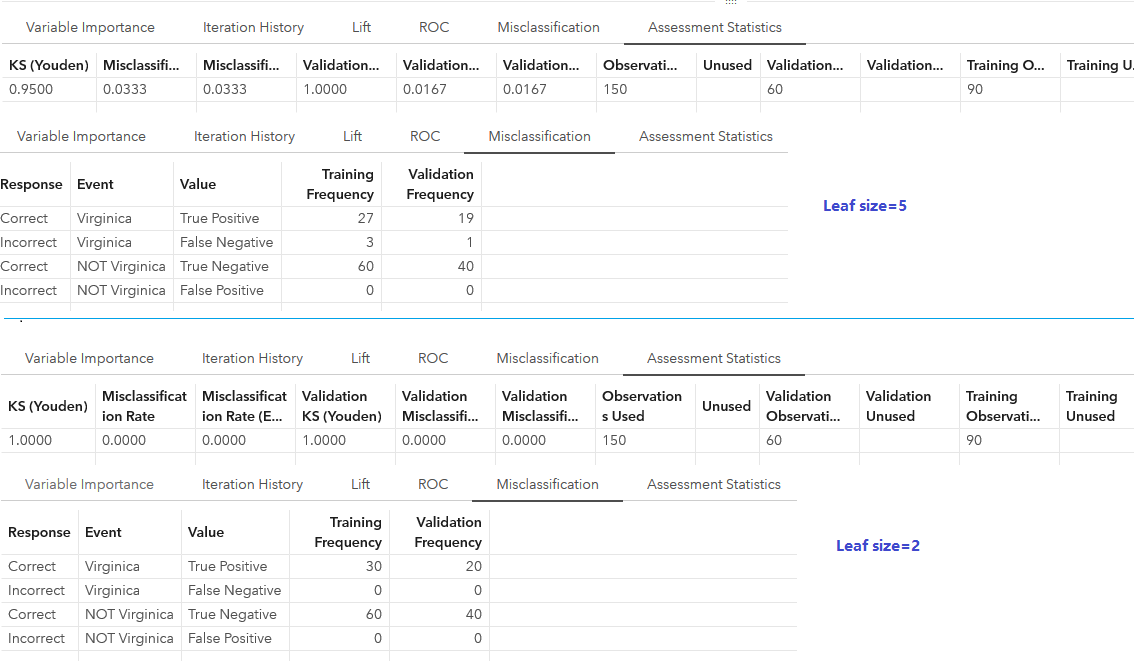
We may continue to tune the parameters of gradient boosting model easily in SAS Visual Data Mining and Machine Learning, to improve the model. For example, if I set smaller leaf size value to 2 instead of the default value of 5, the model accuracy will be improved (too good to be true?). See below screenshot for a comparison.
Of course, people may like to try tuning other parameters, or to generate more features to refine the model. Anyway, it is easy-to-use and straight-forwarded to do classification using gradient boosting model in SAS Visual Data Mining and Machine Learning. In addition, there are many other models in SAS Visual Data Mining and Machine Learning people may like to run for classification. Do you like to play with the other models for practicing?