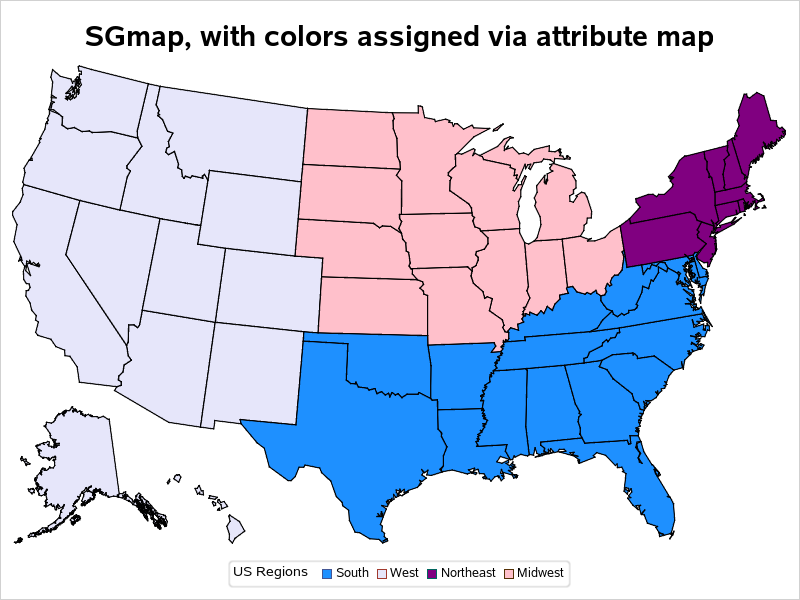
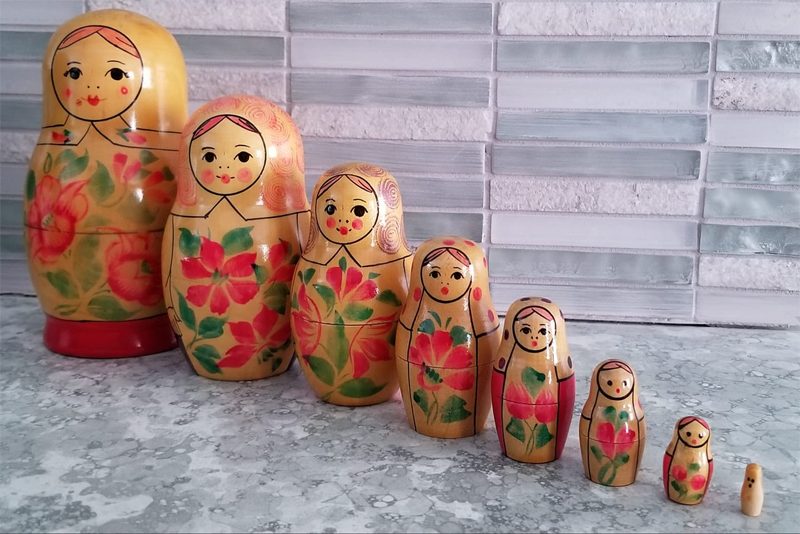
When you get something new, the hope is that it will be better than the old thing it's replacing. As I often do, I asked my Facebook friends to provide a random picture for my blog - in this case, a picture of one of their new/recent purchases. My friend
Search Results: sgmap (58)
If you don't have a SAS/Graph license, then you're probably using the ODS Graphics 'sg' procedures that come with Base SAS to create your graphs and maps. And if you've tried plotting data on a map, you probably noticed that SGmap lets you overlay point-data on an OpenStreetmap, but you
I met many SAS programmers at the 2019 SAS Global Forum who geocode addresses using ArcGIS. Did you know that street address locations and other things can be found using the SAS GEOCODE procedure? PROC GEOCODE gives you coordinates for address, ZIP codes, ZIP+4 codes and cities. You can even
In the previous Graphically Speaking blog for PROC SGMAP, you used PROC GPROJECT so map regions would match OpenStreetMap and Esri background images. This time, the same British Columbia shapefile is used with: PROC GREMOVE to remove unwanted boundary lines PROC GREDUCE to reduce map data PROC GPROJECT to zoom
Sometimes it is difficult to know what parameters to use when projecting map data onto Esri or OpenStreetMaps in PROC SGMAP. The shapefile .PRJ file contains everything you need to set these parameters in PROC GPROJECT. In a previous blog, you saw how to lookup projections at a web site,
As mentioned in other PROC SGMAP blogs, several SAS/GRAPH procedures have been moved to 9.4M6 Base SAS to be used with PROC SGMAP. You can use these to create PROC SGMAP output even when using the free SAS University edition. In this blog you will use the: IMPORT procedure for
In August 2018, Hurricane Florence came on shore in North Carolina. Much of the damage was from flooding because the storm moved slowly over North and South Carolina. Parts of North Carolina had over 30 inches of rain from the storm, and this caused many of North Carolina’s rivers to
Starting with SAS 9.4M6, procedures that used to be provided with a SAS/GRAPH installation are now available with Base SAS. Using these procedures along with PROC SGMAP can help you create some very nice maps. This blog builds on previous posts and highlights the: MAPSSAS Data Sets GREMOVE procedure %CENTROID
An earlier SGMAP blog used the BUBBLE statement to overlay point data on top of an Open Street Map. However, not all map features are points. Some are enclosed areas called polygons. Some map polygons share common borders such as states and counties. Others are separate, non-contiguous regions such as national parks
Data with a geographic component begs to be mapped. That capability is now available to all SAS users. A new mapping procedure in the fifth maintenance release of 9.4 (SAS 9.4M5) allows any user to easily plot data on a map. Unlike previous mapping applications with SAS, the SGMAP procedure
This blog post is mostly just a bunch of fun maps ... maps that are labeled (or mislabeled) in various ways, using fun/interesting data. I focus on the 'fun' part, but if you're not careful you might also learn a little about the various ways to add labels to maps
The rumors are true - The Graph Guy is retiring! I've been working at SAS for about 30 years, and had lots of fun stretching the limits of SAS' graphing & mapping software over the years. But I've decided to retire while I'm still young enough to pursue a lot
SCUBA diving is one of those activities that should be on your bucket list - everyone should experience it at least once! But where should you go diving? ... Coral reefs are always popular - and they are typically in shallow water, making it an 'easy' dive. But, being in
Many cities have Open Data pages. But once you download the data, what can you do with it? This is my fifth in a series of blog posts where I download public data about Cary, NC, and demonstrate how you might analyze that type of data (for Cary, or any
Many cities have Open Data pages. But once you download the data, what can you do with it? This is my third in a series of blog posts where I download several datasets from Cary, NC's open data page, and give you a few ideas to get you started on
Many cities have Open Data pages. But once you download the data, what can you do with it? This is my second blog post where I download several datasets from Cary, NC's open data page, and and give you a few ideas to get you started on your own data
Many cities have Open Data pages. But once you download this data, what can you do with it? I'm going to download several datasets from Cary, NC's open data page, and try to give you a few ideas to get you started on your own data exploration! And what data
"With great power comes great responsibility." I'm not sure exactly where this quote comes from, but I think everyone should keep it in mind when creating graphs and maps! There are many design decisions that can influence how the end user perceives the data in a graph. For example: The
Who's to say that 'north' should always be at the top of a map? Perhaps in certain situations, you might want 'south' (or some other direction) to be at the top. Perhaps you're one of our crazy Australian customers who looks at the world a little differently. Well, whatever the
In a discussion on a Reddit map group, someone claimed "Maine is the US state closest to Africa." Is that true? Can I use my SAS mapping tools to confirm, or bust, this myth? Follow along, as I dive in! ... The Map in my Head (Wrong!) My gut instincts
Here in the US, the pipeline which supplies gasoline to North Caroline (and much of the southeast) was hacked, and had to be shut down for several days. This caused gasoline shortages, and long lines at the gas pumps (as shown in the picture below, by my friend Daniel). But
Lake Superior is the largest freshwater lake (by surface area) in the world. And its largest island is Isle Royale. And its largest lake is Lake Siskiwit. And its largest island is Ryan Island. Ryan Island's largest (seasonal) pond is called Moose Flats. And it contains an 'island' (or a
I think one of the great uses of analytics and graphics is to show things like cancer clusters on a map. There are many factors that can lead to a higher incidence of diseases in geographical areas, and chemicals are often the culprit. For example, paraquat has been potentially linked
Every 10 years the United States conducts a Census where we count all the people. This week the 2020 Census population totals for each state were released. And how might these numbers affect you? ... One thing the Census numbers are used for is to determine how many of the
Everybody likes to learn a bit of interesting trivia... It could make you look smart, or might help you win a bet in a bar. Or maybe give you something to amaze your kids with. Do you know what's the biggest non-domesticated land animal in your state? How about all
This is another in my series of blog posts where I take a deep dive into converting customized R graphs into SAS graphs. Today we'll be working on shapefile maps ... And what data will we be using this time? Here's a hint - the picture below is the Aurora
Note from Udo Sglavo: In our peace of mind blog series, we documented areas of analytics that are either evolving or not necessarily in the standard toolset of data scientists. We looked at causal modeling, network analytics, and econometrics, to name a few. With this blog post, we would like
This is another in my series of blog posts where I take a deep dive into converting customized R graphs into SAS graphs. Today we'll be working on bubble maps - specifically, plotting earthquake data as bubbles on a map. R bubble map, created using geom_polygon() and geom_point() SAS bubble
This is another in my series of blogs where I take a deep dive into converting a customized R graph into a SAS ODS Graphics graph. Can you guess what data I'll be using this time? Here's a photo with a hint. This is Keeler, California (just west of Death
Have you been stuck at home, dreaming up the next big trip you'll take after this pandemic is over? How will you pick a really cool location to visit? Perhaps you can ask your friends for suggestions. My co-worker (and lunch buddy) John recommended the Grand Prismatic Spring. Here's a