When you get something new, the hope is that it will be better than the old thing it's replacing. As I often do, I asked my Facebook friends to provide a random picture for my blog - in this case, a picture of one of their new/recent purchases. My friend Mark, from Germany, provided this picture of his new trail running shoe. Hopefully this shoe will make him run 20% faster, and with 50% more ease/comfort!!! 🙂

So it is with shoes, so it is with software ... A new version of SAS was recently released with new features to make it more capable, and hopefully make your life easier! In this case, the SAS release is 9.4 maintenance 7, and the new features I'm most excited about are in Proc SGmap. Proc SGmap is similar to Proc GMap (included in the SAS/Graph product), except SGmap is part of ODS Graphics which is included in Base SAS. SGmap is a fairly new ODS Graphics procedure, with features still being added. Follow along as I highlight SGmap's new features that were added in 9.4m7.
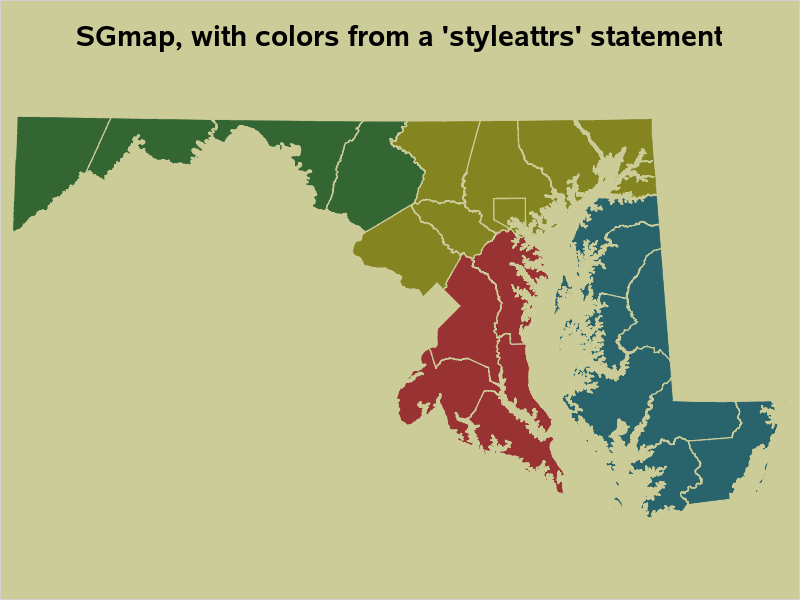
Specifying Colors
Whereas you previously had to modify an ODS Style to control the colors of your choropleth map, now you can do it with a simple styleattrs statement, such as:
proc sgmap maprespdata=my_data mapdata=my_map noautolegend;
styleattrs datacolors=(cx336633 cx993333 cx848421 cx29636b) backcolor=cxcccc99;
choromap region / mapid=county lineattrs=(color=cxcccc99);
run;
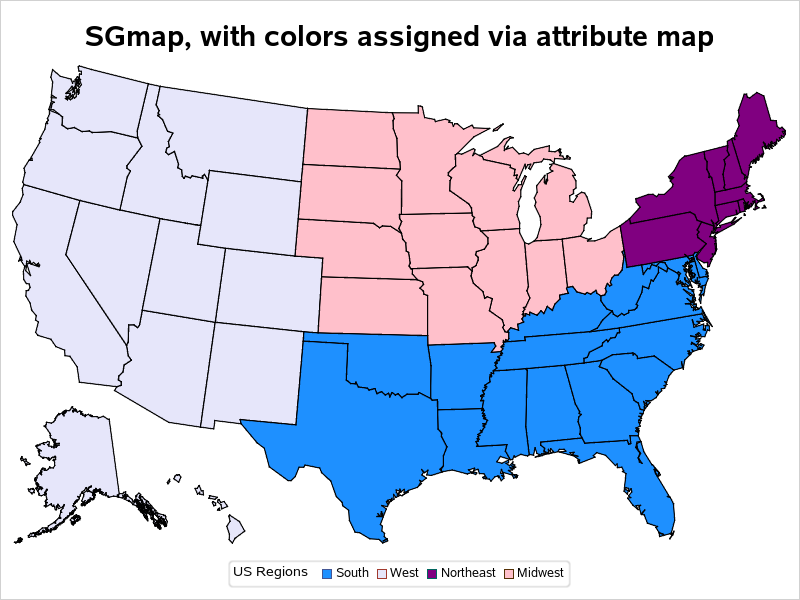
Attribute Maps
Previously, if you wanted to make sure certain data values were mapped as certain colors, you had to be very careful with the way your data was sorted, and make sure all of the same values were represented in your response data (that might mean inserting missing values, etc). Now you can do it much more directly by using an attribute map.
data my_attrmap;
length value fillcolor $20;
input value fillcolor;
id='regioncolors';
datalines;
West lavender
South dodgerblue
Northeast purple
Midwest pink
;
run;
proc sgmap maprespdata=sashelp.us_data mapdata=mapsgfk.us dattrmap=my_attrmap;
choromap region / mapid=statecode id=statecode attrid=regioncolors;
run;
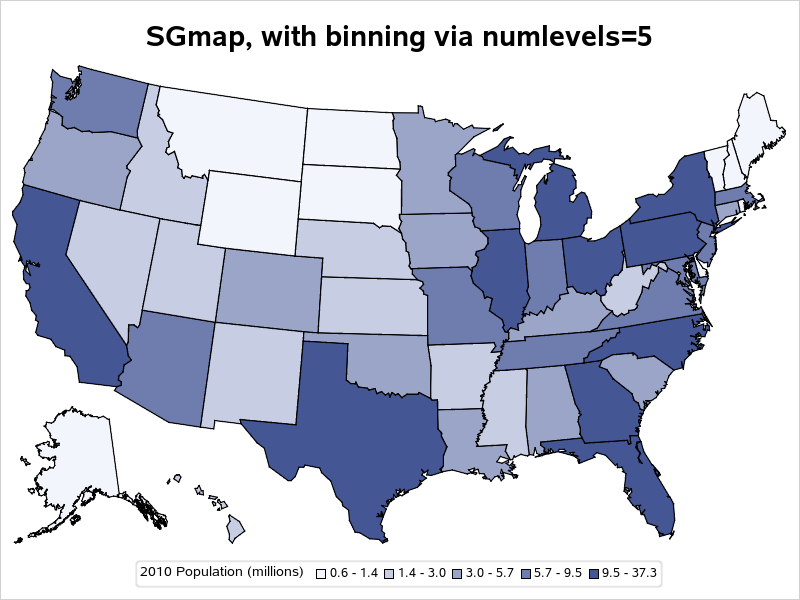
Legend Binning
Previously, if you wanted to create a map with 5 levels of quantile binning, you'd have to pre-process your data (using a tool such as Proc Rank), and calculate the bins yourself. Now you can use the numlevels= and leveltype= options to easily create maps with various kinds of binning, without pre-processing your data! You can use either discrete or gradient legends to show the binned ranges.
proc sgmap maprespdata=my_data mapdata=mapsgfk.us;
choromap population_2010 / mapid=statecode id=statecode numlevels=5 leveltype=quantile;
run;
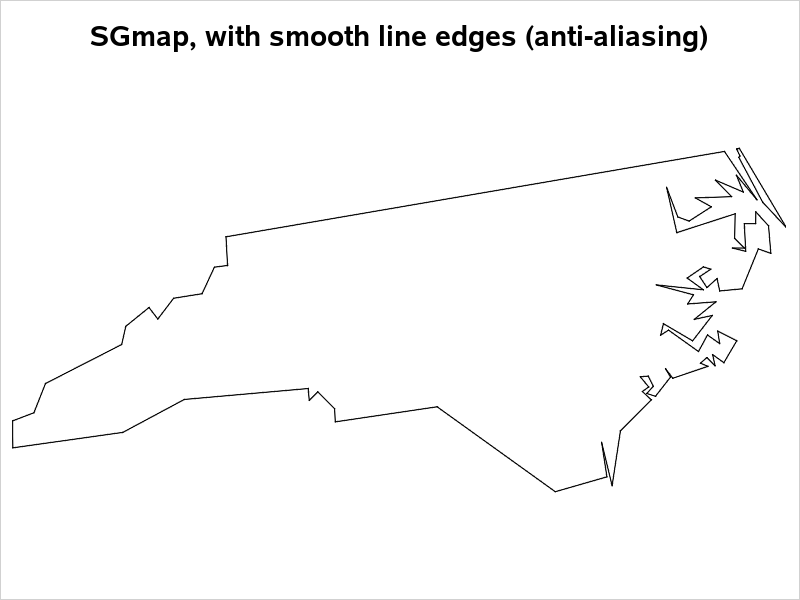
Smoother Edges
Previously, if you looked very closely at angled lines in a map, you might see a little jaggedness. But now SGmap performs anti-aliasing (filling in the jaggies with lighter shades of the line color) so that the lines look very smooth. You don't have to specify any options, or do anything extra - this feature is automatically applied in 9.4m7.
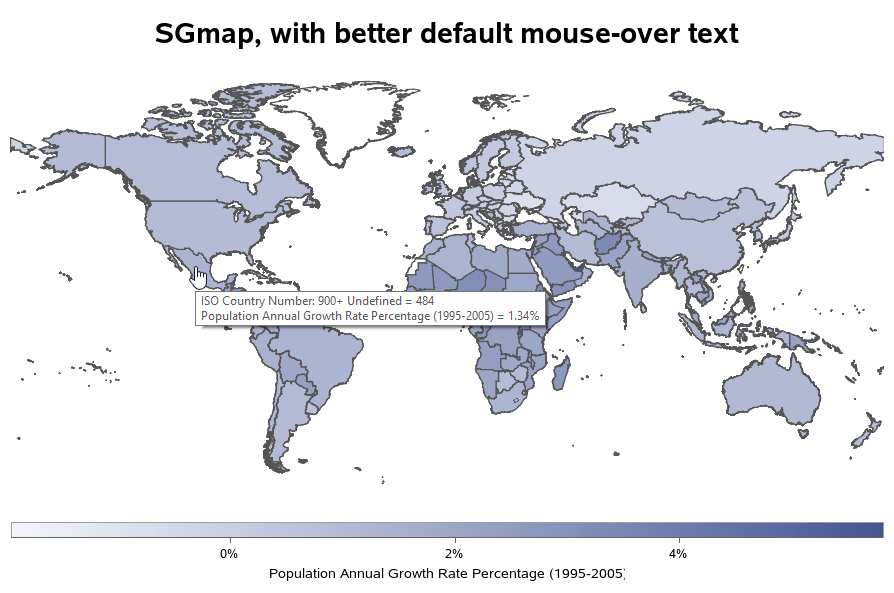
Default Mouse-over Text
Previously the default mouse-over text (when you turn on the ods graphics imagemap option) was all on one line. Now it's split onto multiple lines, and easier to read.
ods graphics / imagemap;
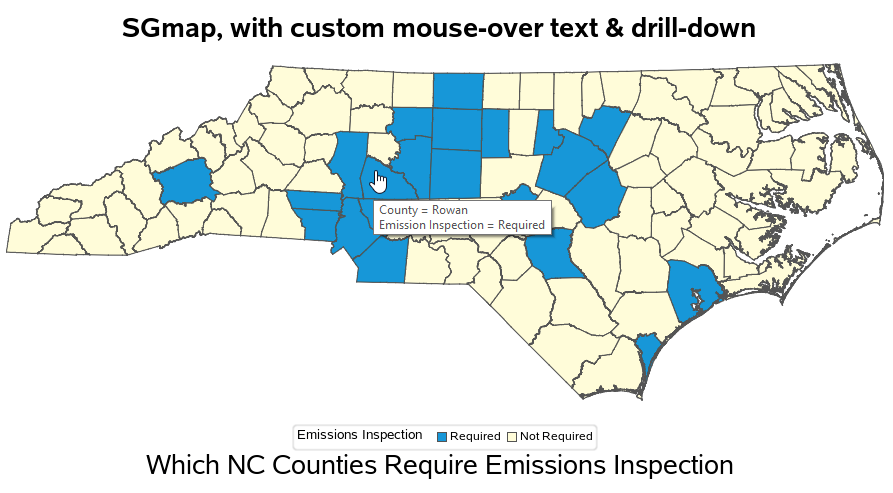
Custom Mouse-over Text and Drill-down
Another new feature in 9.4m7 is the ability to specify custom mouse-over text, and drill-down for the choropleth map areas. The new url= drill-down option is probably my favorite enhancement to the SGmap functionality! 🙂
data my_data; set my_data;
length my_url $300;
my_url='https://www.ncdot.gov/dmv/title-registration/emissionssafety/Pages/inspection-stations.aspx?term='||trim(left(idname))||'county&field=county';
run;
proc sgmap maprespdata=my_data mapdata=my_map;
styleattrs datacolors=(cx0095da cxfffcd6);
choromap Inspection / mapid=county lineattrs=(color=gray55)
tip=(idname inspection)
tiplabel=('County' 'Emission Inspection')
url=my_url;
run;
Gradient Colors
Previously, you had to modify the ODS style to control the color ramp in a gradient choropleth map. Now you can more easily do it using the new colormodel= option on the choromap statement.
proc sgmap maprespdata=sashelp.us_data mapdata=mapsgfk.us;
choromap population_2010 / mapid=statecode id=statecode colormodel=(grayee gray55);
run;

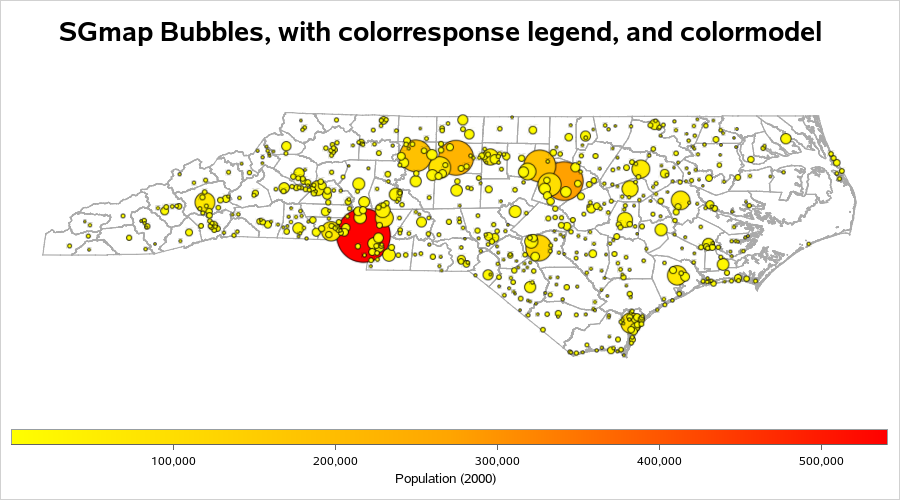
Bubble Gradient Colors
Previously, you had to modify the ODS style to control the gradient colors of the bubbles. Now you can control the colors using the new colormodel= option.
proc sgmap plotdata=my_data mapdata=my_map noautolegend;
choromap / mapid=county lineattrs=(color=grayaa);
bubble x=long y=lat size=pop / bradiusmin=1 bradiusmax=30
colorresponse=pop colormodel=(yellow orange red) name='bub';
gradlegend 'bub';
run;
Hopefully you're as excited about these new features as I am! Feel free to share what you plan to do with them in the comments. And if you'd like to read a little more about them, and see more detailed sample code, here's my SESUG paper.


