Data with a geographic component begs to be mapped. That capability is now available to all SAS users. A new mapping procedure in the fifth maintenance release of 9.4 (SAS 9.4M5) allows any user to easily plot data on a map. Unlike previous mapping applications with SAS, the SGMAP procedure requires only BASE. That makes SGMAP fully functional in the SAS University Edition, too.
The initial release of SGMAP includes a BUBBLE statement allowing you to plot locations and size bubbles using response values. Let’s use that feature to view alternative power generation data.
People love electricity and the modern world requires lots of it. For various reasons we are moving away from traditional carbon-based and nuclear electrical generation. Alternative methods such as solar, low-head hydro and wind are becoming more cost effective and widespread.
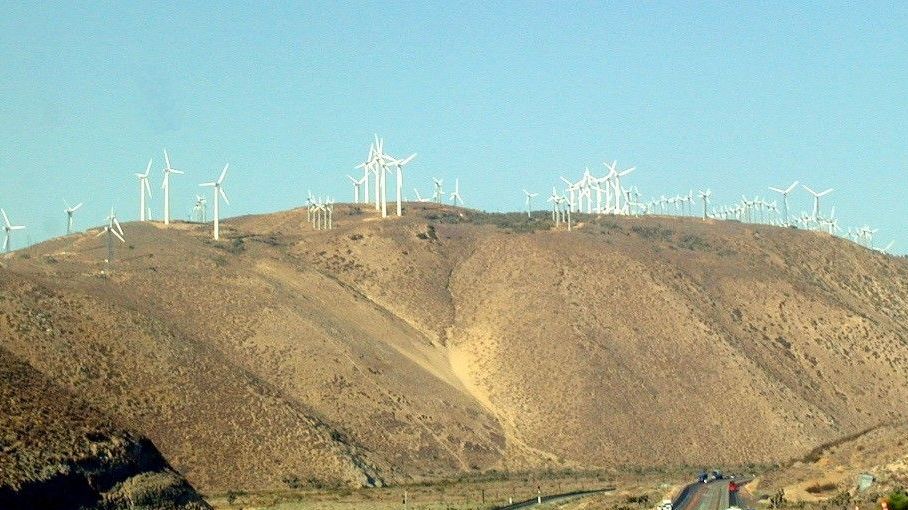
While passing through Mojave, California in 2000, I was so surprised to see hilltops lined with wind turbines that I stopped to take a picture. That was not a sight I’d ever seen anywhere in the eastern U.S.
So where is wind used to generate electricity? It did not take long to find an annual report on the U.S. Energy Information Administration (EIA) site, Form EIA-860. Downloading the latest ZIP file shows two files of interest. 3_2_Wind_Y2016.xlsx includes wind power turbine capacities at power plants across the U.S. and 2___Plant_Y2016.xlsx includes the latitude and longitude of those plants which we need to map them.
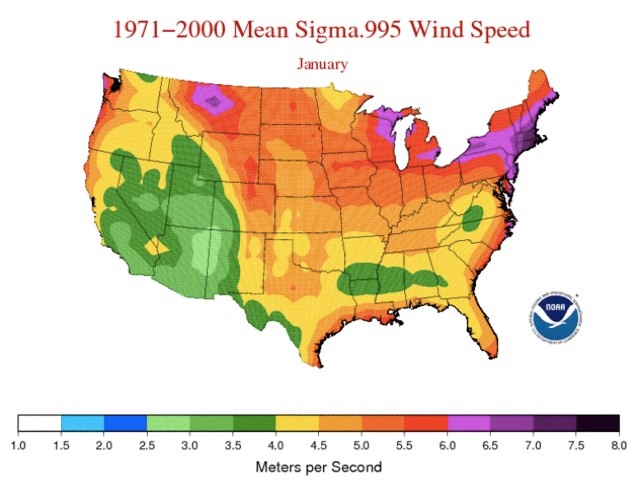
Importing the Excel files into SAS creates two data sets: POWER_PLANTS with plant locations and TURBINE_PARAMETERS with details on each plant's wind turbines. Since each site can house multiple turbines, the SUMMARY procedure calculates total wind power generation capacity per site. Combining those data sets creates TURBINES_BY_SITE with power plant identifiers and total wind power generation capacities.
After sorting the data sets, we merge them to assign the latitude/longitude of the power plants to the generation capacities. The data is now ready for mapping!
The PROC SGMAP syntax for displaying the power plant points is pretty simple:
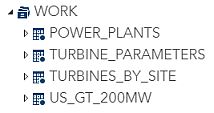
proc sgmap plotdata=US_GT_200MW;
openstreetmap;
bubble x=long_num y=lat_num size=MW_total;
run;
That code invokes SGMAP and the PLOTDATA= option specifies the data set containing the wind power turbine capacities and locations. Next is a simple OPENSTREETMAP statement to overlay the power plant sites onto an Open Street Map (OSM) base. The map automatically scales to fit the geographical range of the latitude/longitude values in the plant data.
The next statement draws a BUBBLE at each turbine location using the numeric longitude and latitude variables (long_num/lat_num). The BUBBLE diameters reflect total generation capacity at the site (MW_total). The RUN statement ends SGMAP and creates a map of all U.S. sites with more than 200 MW of wind power generation capacity.
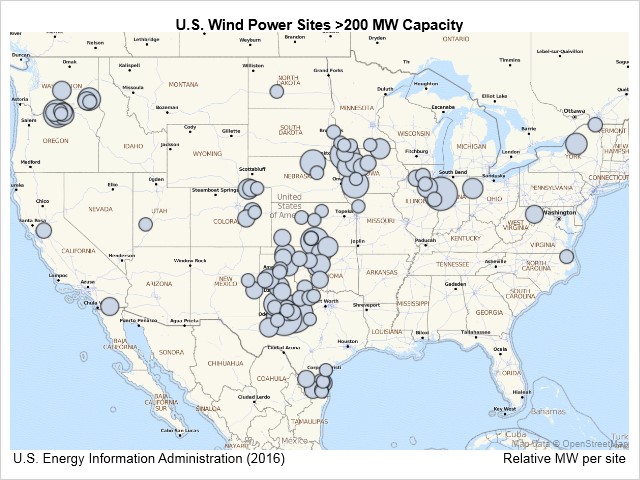
The National Oceanic and Atmospheric Administration publishes maps of historical wind speeds across the U.S. You can see that the large wind power facilities plotted with SGMAP closely align with regions having significant winds.
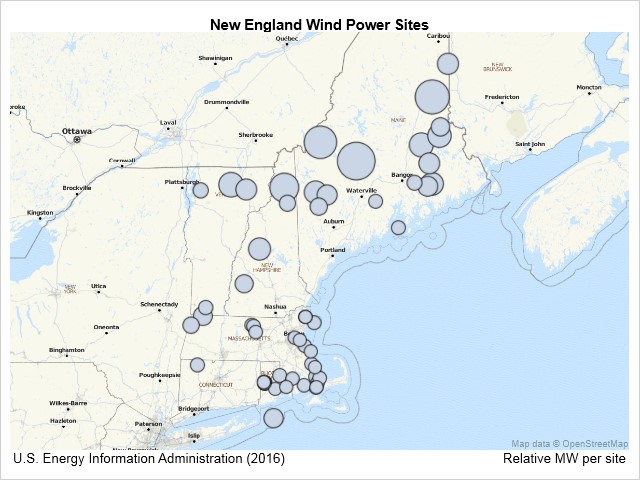
You can also subset the power plant data to create maps of specific regions, such as the next map of sites in the six New England states. Again the Open Street Map base is automatically sized for the spatial extent of the bubble locations.
The complete SAS program is Map_Wind_Power_Sites. In order to run it, you will have to download the zipped Excel files from the EIA. Instructions are included in the source code file. See the SGMAP documentation for additional information on its use.
So BASE and University Edition users with SAS 9.4M5 can now easily generate maps with the new SGMAP procedure.


9 Comments
This is amazing, and I am so excited to be having M5 installed on my system this weekend! In advance I was searching for documentation on SGMAP and could not find it, so this is very timely. I will be presenting an invited paper on mapping at SAS Global Forum and this ability will definitely factor in my presentation. Thank you!
There's just one downside: as of 9.4 M5, the procedure is available only on Linux and Windows. SAS for AIX (and probably HP-UX, Solaris, z/OS) does not have it.
While SGMAP may be moved to other platforms at some point, for the foreseeable future it will be available only on Linux and Windows 64.
Hi Ed,
Any idea when choromap might be updated to include features like "nomissinggroup", or better control over the colours and patterns used?
Thanks!
The recent 9.40M6 release included quite a few enhancements to SGMAP. The next round of new functionality is under consideration and the options you list will be evaluated for inclusion. Thanks.
I have NOMISSINGGROUP in an SGMAP SERIES example here:
https://blogs.sas.com/content/graphicallyspeaking/2018/11/29/proc-sgmap-series-plot-importing-shapefiles-and-using-proc-gproject/
I'm going to also include it in my next blog using SGMAP SCATTER.
Pingback: Drawing paths on a map using SGplot - SAS Learning Post
Unfortunately, I only have the sas version 9.3 on my computer.
Pingback: Making great graphs even better with ODS Graphics - SAS Users