In August 2018, Hurricane Florence came on shore in North Carolina. Much of the damage was from flooding because the storm moved slowly over North and South Carolina.
Parts of North Carolina had over 30 inches of rain from the storm, and this caused many of North Carolina’s rivers to overflow their banks because the water just does not have any place to go.
In this example, North Carolina GeoSpatial data for the major river basins is downloaded and used in PROC SGMAP as SERIES statements. The path of the storm is also plotted so you can see why the Cape Fear River Basin had major flooding.
This example is building on earlier blog entries and highlights the:
- MAPIMPORT procedure
- GPROJECT procedure
- PROC SGMAP SERIES statement
Here is the complete code for this example.
Working with the Shapefiles
Download data from NC OneMap North Carolina GeoSpatial Portal, and search for “Major Hydrography” and download this shapefile.
Once the shapefiles have been unzipped, use PROC MAPIMPORT to import the data:
proc mapimport out=hydro datafile="u:\nc_hydrography\hydromaj_arc.shp"; run; |
OpenStreetMaps and Esri Maps require WGS 84 coordinates. Use PROC GPROJECT to change coordinates.
Here is an example of how this procedure looks. id objectid is used because many shapefiles use this variable to organize data.
proc gproject data=datain out=dataout from="<parameters>" to="<parameters>" id objectid; run; |
A PRJ file is included with the shapefiles. This file includes a line something like this:
NAD_1983_StatePlane_North_Carolina_FIPS_3200 and UNIT["Meter",1.0]
This is an indication of the parameters used for the GProject from= option.
See spatialreference.org for these projections. For the above example, search for North Carolina State Plane and you will see NC State Plane Coordinate System. Click on that and then click the link for the Proj4 to reveal this:
+proj=lcc +lat_1=34.33333333333334 +lat_2=36.16666666666666 +lat_0=33.75 +lon_0=-79 +x_0=609601.22 +y_0=0 +ellps=GRS80 +datum=NAD83 +units=m +no_defs
Use this string for from= in GPROJECT. The to= setting is always EPSG:4326 for OpenStreetMap and Esri maps.
PROC GPROJECT for this example is:
proc gproject data=hydro1 out=hydro1 from="+proj=lcc +lat_1=34.33333333333334 +lat_2=36.16666666666666 +lat_0=33.75 +lon_0=-79 +x_0=609601.22 +y_0=0 +ellps=GRS80 +datum=NAD83 +units=m +no_defs" to="EPSG:4326"; id objectid; run; |
Plotting the SERIES Data
Now that you have the river basin data imported and in the correct coordinates, use the PROC SGMAP SERIES statement to plot the river basin.
The Cape Fear river is about 30 miles south of SAS headquarters and there were reports of the flooding each day. To see this, limit the data to the Cape Fear River Basin:
data hydro1; set hydro; where riv_basin='Cape Fear'; run; |
And plot it:
proc sgmap plotdata=hydro1; openstreetmap; series x=x y=y / legendlabel='Cape Fear Basin'; run; |
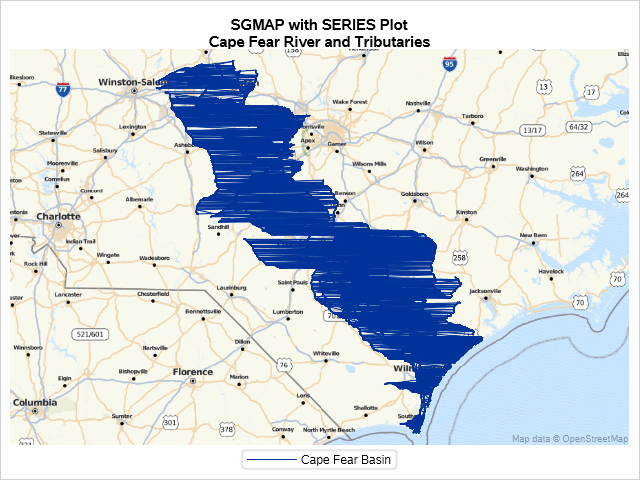
That doesn’t look very good. All the rivers and streams are connected to each other and wrapping around. Maybe using the GROUP option will fix it:
proc sgmap plotdata=hydro1; openstreetmap; series x=x y=y / group=stream_nam; run; |
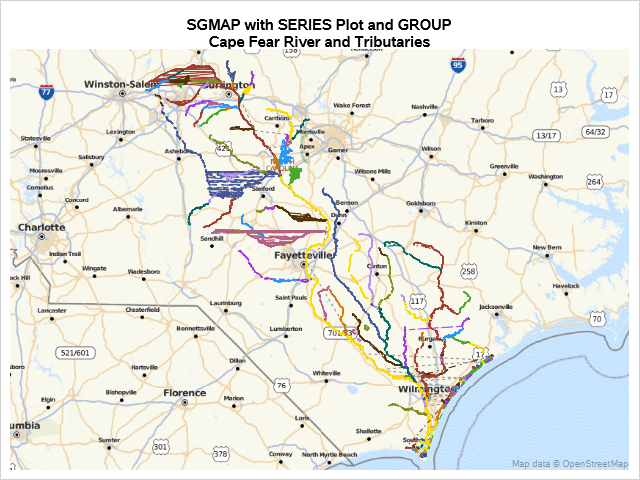
That is better, but some of the rivers and streams still wrap.
The PROC SGMAP SERIES statement breaks lines when there is a missing Y variable value. The missing values are needed when plotting several series lines.
Add some missing Y values in the data by sorting the data by objectid, then use the LAST.variable to insert a record with a missing Y:
proc sort data=hydro1 out=hydro1; by objectid; run; data hydro1; set hydro1; by objectid; if last.objectid then do; output; y=.; output; end; else output; run; run; |
Try running without GROUP since segments are now separated by missing Y values:
proc sgmap plotdata=hydro1; openstreetmap; series x=x y=y; run; |
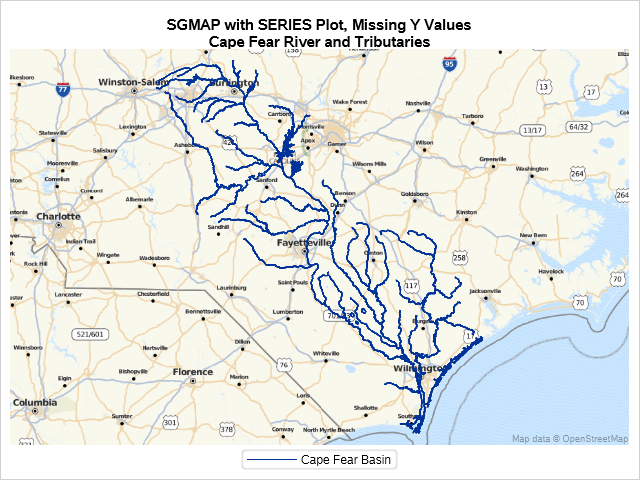
That looks good. The different tributaries for the Cape Fear River are now clear.
Why was this river and all its tributaries a problem after Hurricane Florence? Try plotting the storm's path and strength to find out.
There are several websites that contain hurricane tracking information. Combine the river basin data with the hurricane track data and plot using SERIES and BUBBLE statements in PROC SGMAP.
proc sgmap plotdata=both; openstreetmap; /* series plot for rivers */ series x=x y=y; /* plots for the tropical storm */ series x=long y=lat / smoothconnect; bubble x=long y=lat size=wind / transparency=.6 group=type nomissinggroup datalabel=date datalabelpos=bottomright datalabelattrs=(color=cxf42941 size=10) name="bubble"; /* add a title to the legend */ keylegend "bubble" / title="Storm Classification"; run; |

On the East Coast, much of the rainfall from a hurricane occurs on the north side of the storm, so you can see why the path of Hurricane Florence causes flooding in the Cape Fear River Basin. There was just too much water.
From this example, you can see that PROC SGMAP is an easy way to plot data from shapefiles and CSV files on Esri maps and OpenStreetMaps.

2 Comments
Great post!
Thank you Louise!
My upcoming blog will be using PROC SGMAP with PROC GINSIDE and GEODIST.