In the previous Graphically Speaking blog for PROC SGMAP, you used PROC GPROJECT so map regions would match OpenStreetMap and Esri background images.
This time, the same British Columbia shapefile is used with:
- PROC GREMOVE to remove unwanted boundary lines
- PROC GREDUCE to reduce map data
- PROC GPROJECT to zoom into the map
All of these procedures are included in Base SAS 9.4M6.
Here is the complete code for this example.
Removing Unwanted Boundary Lines
Here is the output from the previous blog with an Esri background map:
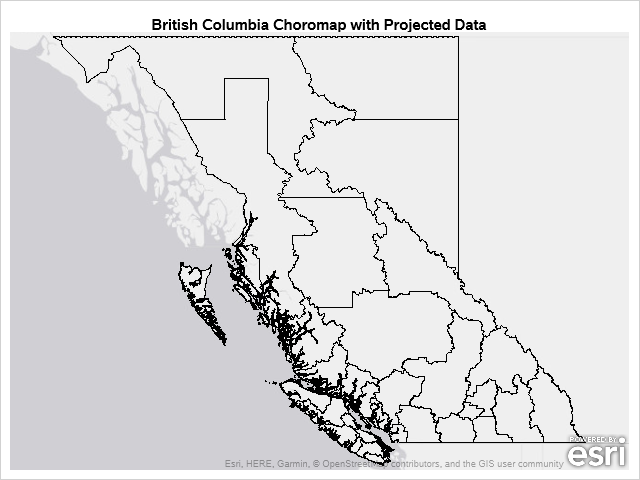
For this map, you are interested in only showing the outlines of British Columbia and not the districts. Remove the internal boundary lines using PROC GREMOVE:
proc gremove data=BC out=BC_gremove; by pruid; id cdname; run; |
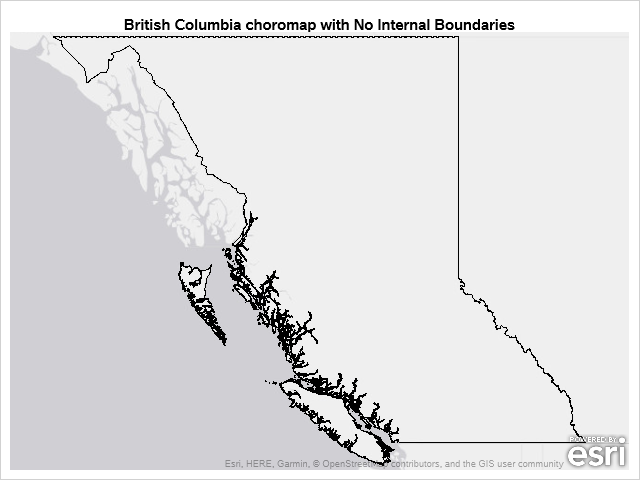
Notice that the coastline is very jagged and appears to have thick dark lines. This occurrs because there are 572,019 points in the choromap.
Use PROC GREDUCE to Reduce Choromap Data
You can use the PROC SGMAP DENSITY option to limit the data drawn, but this requires a variable named DENSITY to be included in the map data. Map data sets supplied by SAS include the DENSITY variable, but other map data sets may not.
You can add the DENSITY variable to your map data using PROC GREDUCE. Note that PROC GREDUCE can take several minutes to complete depending on your data set.
proc greduce data=BC_gremove out=BC_reduced; id pruid; run; |
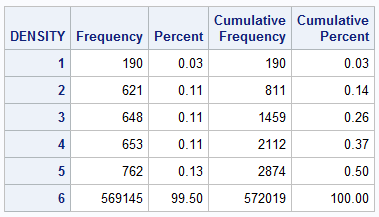
Here is the PROC FREQ output of the new DENSITY variable:
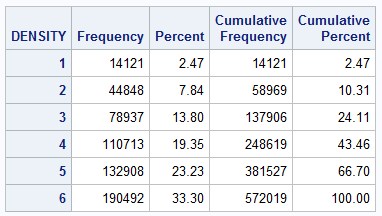
Try density=1 in PROC SGMAP to use the least number of points:
proc sgmap mapdata=BC_reduced noautolegend; esrimap url="&url/Canvas/World_Light_Gray_Base"; choromap / mapid=pruid density=1; run; |
This time you plotted 14,121 data points and it looks better, but the coastline still looks a little dark.
You can reduce the data even more using the N1 – N5 options. These options control the number of points for each density level. See the SAS PROC GREDUCE documentation for more.
Try setting the options like this to reduce the data. This gives you several density levels to try:
proc greduce data=BC_gremove out=BC_reduced2 n1=100 n2=300 n3=500 n4=700 n5=900; id pruid; run; |
Here is the PROC FREQ output of this data:
Try PROC SGMAP with density=1:
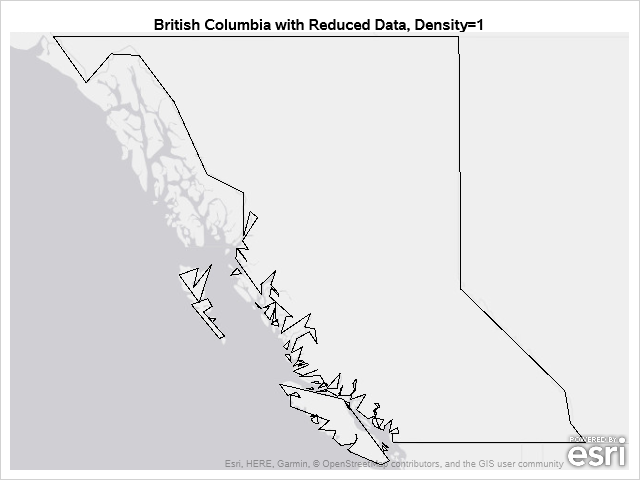
That does not look very good. Try PROC SGMAP with density=2:
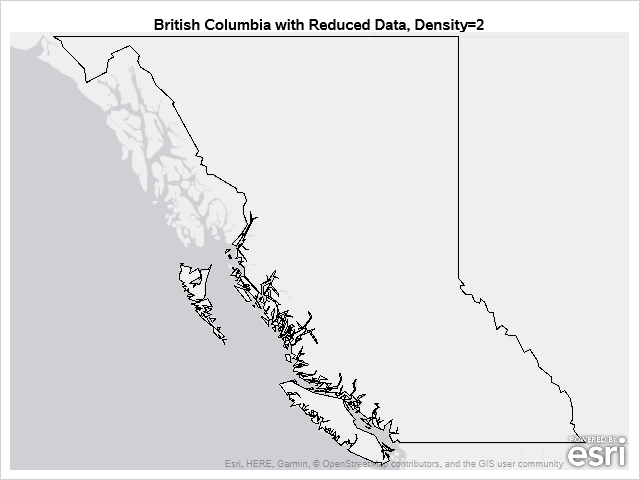
That looks better. The coastline is no longer a bunch of dark lines.
Zoom In using PROC GPROJECT
Zoom into the coastline with PROC GPROJECT by limiting the data using the longitude and latitude.
proc gproject data=BC_reduced2 out=BC_projected degrees /* input coordinates are degrees */ project=none /* do not project the output coordinates */ /*longmin= */ longmax=-123 /*latmin= */ latmax=56 ; id pruid; run; |
Then, run PROC SGMAP using density=2 as above:
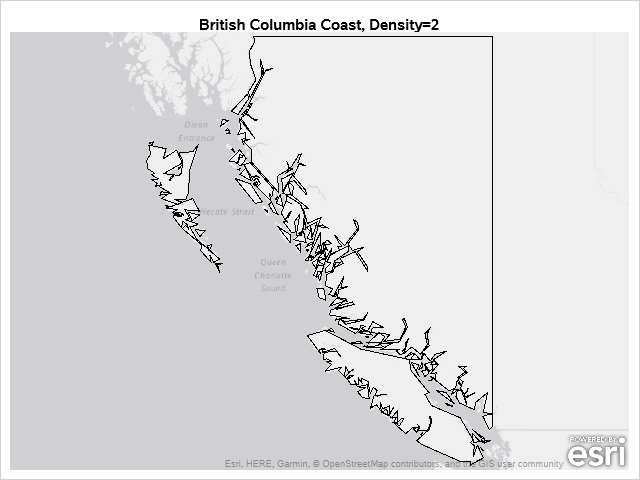
Zooming in to the coast made your choromap region look blocky. Try PROC SGMAP with density=3:
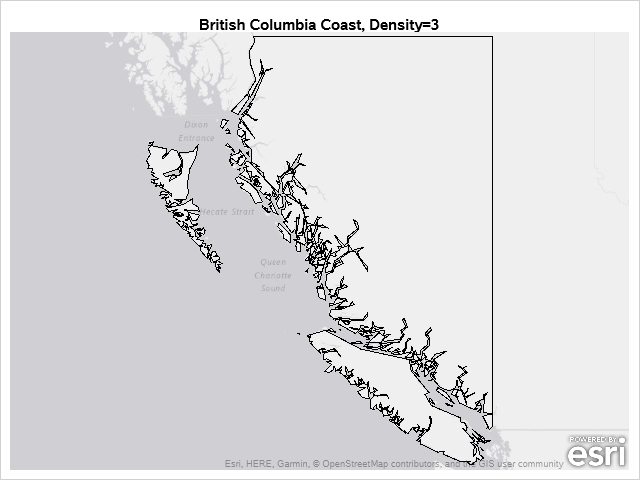
That looks nice.
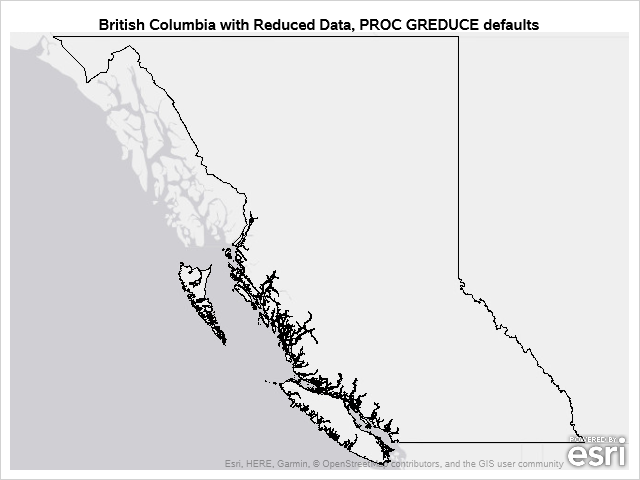
What if you did not use PROC GREDUCE and only used the original data? The choromap lines along the coast look dark:
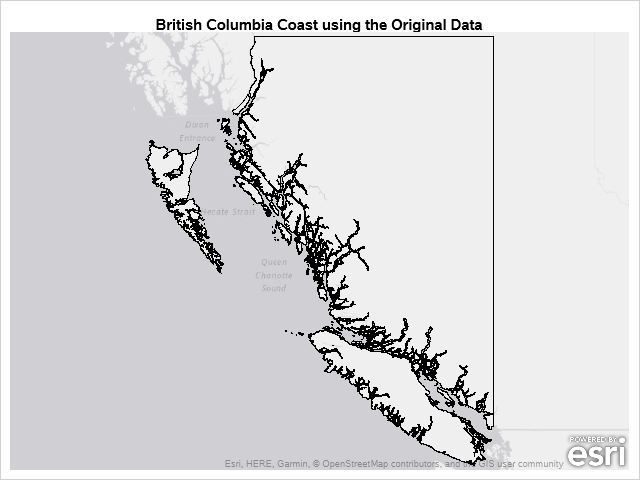
Not only did using reduced data make the map look a little nicer, it also reduced the processing time of PROC SGMAP.
In this example you added the DENSITY variable to your downloaded map data so that you can use it in PROC SGMAP.
Future blogs will include:
- PROC GEOCODE to plot points on PROC SGMAP output
- PROC SGMAP Choromap with numeric and character response values, and
- working with PROC SGMAP legends.