SCUBA diving is one of those activities that should be on your bucket list - everyone should experience it at least once! But where should you go diving? ...
Coral reefs are always popular - and they are typically in shallow water, making it an 'easy' dive. But, being in shallow water, you could probably get by with just using a mask and snorkel rather than SCUBA tanks and such. I think SCUBA diving really shines with wreck diving in the deeper water where you probably couldn't go otherwise (40-120ft). And exactly where are these deeper wrecks located? That's what I focus on in this blog post!
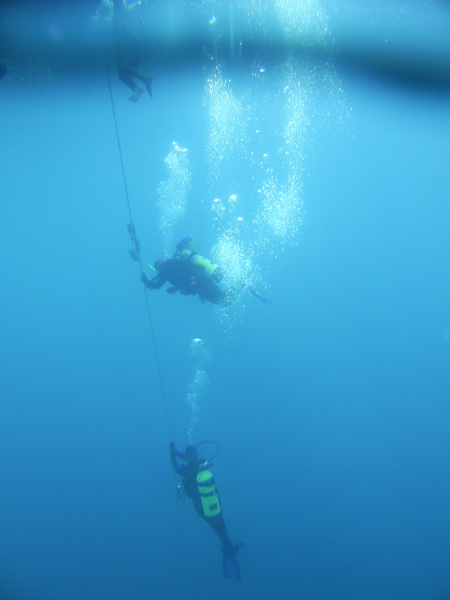
But first, here's a picture to get you into the right frame of mind to study wreck diving sites. This is a picture I took in 2008, on a dive trip with Discovery Diving, on the U352 and Aeolis shipwreck sites. Now, let's dive into the code...
There are shipwrecks all over the world, but I wanted to focus on an area small enough to show some interesting ocean floor detail (in addition to the wreck locations). And what area did I choose? ... Well, of course the North Carolina coast! This area has a rich history of shipwrecks, and even has the nickname "Graveyard of the Atlantic." Shipwrecks off the NC coast include the early "ironclad" USS Monitor, Blackbeard's pirate ship, and many military and merchant ships sunk during World War II.
A few years ago I did a bunch of research and compiled a list of shipwrecks from various sources. I stored the data in a text file, in the following format:
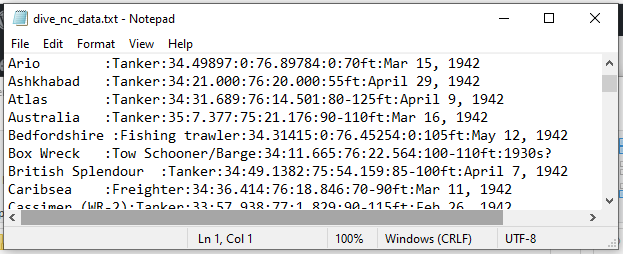
I imported the data into SAS using the following code:
filename divedata 'dive_nc_data.txt';
data dive_data;
infile divedata lrecl=300 pad;
input whole_line $ 1-300;
length site $50 type $30 depth $20 sink_date $200;
site=scan(whole_line,1,':');
type =scan(whole_line,2,':');
latdegrees=.; latdegrees =scan(whole_line,3,':');
latminutes=.; latminutes =scan(whole_line,4,':');
longdegrees=.; longdegrees =scan(whole_line,5,':');
longminutes=.; longminutes =scan(whole_line,6,':');
depth=scan(whole_line,7,':');
sink_date=scan(whole_line,8,':');
lat=latdegrees+(latminutes/60);
/* the -1 converts westlong to eastlong */
long=-1*(longdegrees+(longminutes/60));
/* create a Google search for this diving site */
length search_link $200;
search_link='http://images.google.com/images?q='||trim(left(site))||'+scuba+diving+nc';
run;
And now I can easily plot the dive locations on a map, using the following minimal code. Note that it required more code to read in the data, than to plot it on the map - have we made creating maps easy, or what!?!
proc sgmap plotdata=dive_data noautolegend;
openstreetmap;
scatter x=long y=lat / markerattrs=(symbol=circlefilled size=5pt color=red);
run;
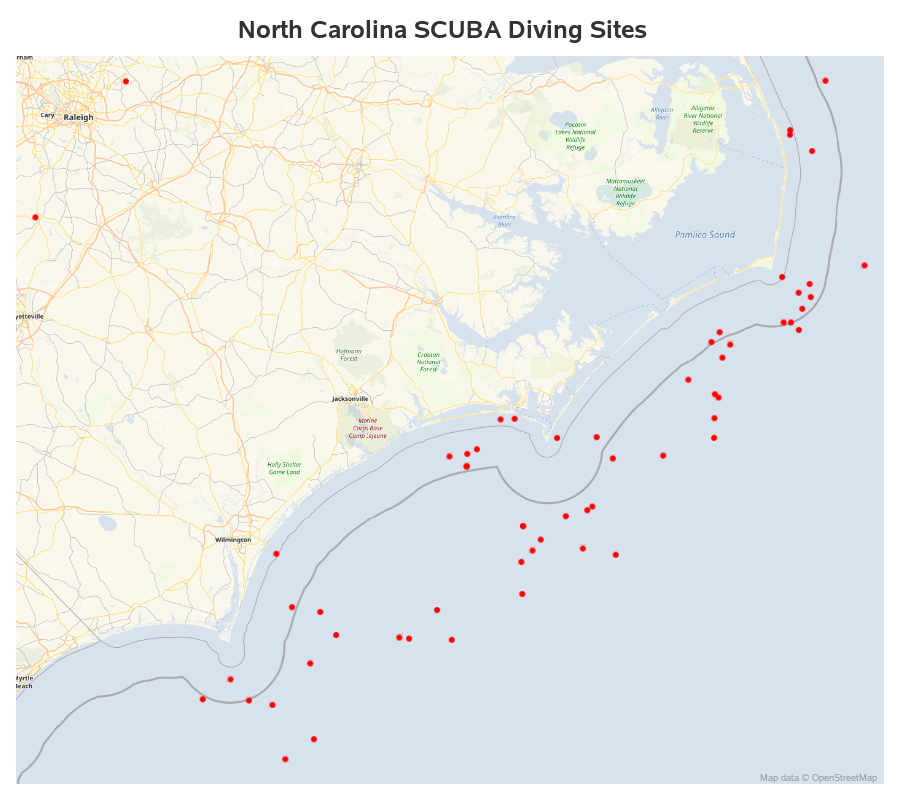
That's a pretty decent map, and it gives you a good general feel for where the dive sites are ... but we could do so much more with this data! Therefore I made a few enhancements.
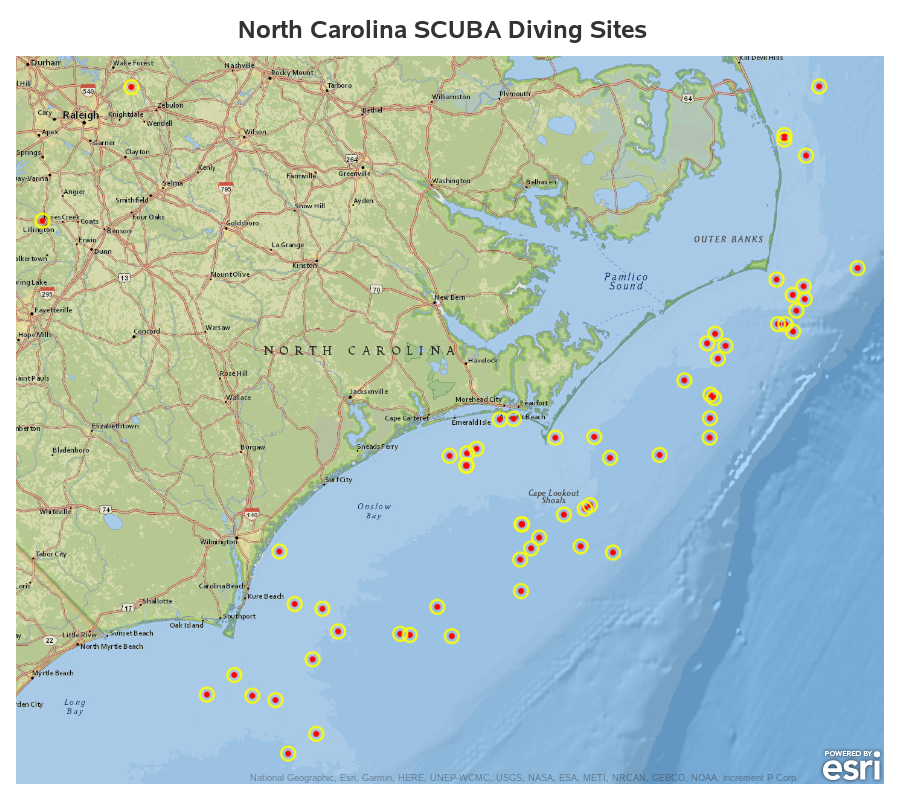
- Rather than using the OpenStreetmap background, I specified an Esri background map that shows the ocean floor contours. This way you can visually see which wrecks are in shallower or deeper water.
- I overlaid an additional scatter plot, to draw a yellow circle around each red marker.
- I used the tip= option to add extra variables that I want to appear in my custom mouse-over text.
- I used the url= option to add a "drill down". When you click each marker, it will launch a Google image search and show you pictures associated with the selected wreck. (This is a really cool addition, I think!)
The enhancements require a bit more code, but they're worth the extra effort. Here's the specific code, with the additions in bold:
proc sgmap plotdata=dive_data noautolegend;
esrimap url="http://services.arcgisonline.com/arcgis/rest/services/NatGeo_World_Map";
scatter x=long y=lat / markerattrs=(symbol=circlefilled size=5pt color=red) tip=none;
scatter x=long y=lat / markerattrs=(symbol=circle size=12pt color=yellow)
tip=(site type sink_date depth) tiplabel=('Site' 'Type' 'Sank' 'Depth')
url=search_link;
run;
And here's an image of the final map (click this link to see the interactive version, with the mouse-over text and drill downs). Notice how the markers stand out now, and you can see whether the wrecks are in deeper water. And you're really gonna like clicking around on this interactive version!
So, have I convinced you that you should learn how to dive? And/or have you learned some new SAS mapping techniques you can apply to your own data? Hopefully so! (And here's the full SAS code and data, if you'd like to experiment with it.)


