Learn about the latest tips, tutorials, upcoming events and certifications
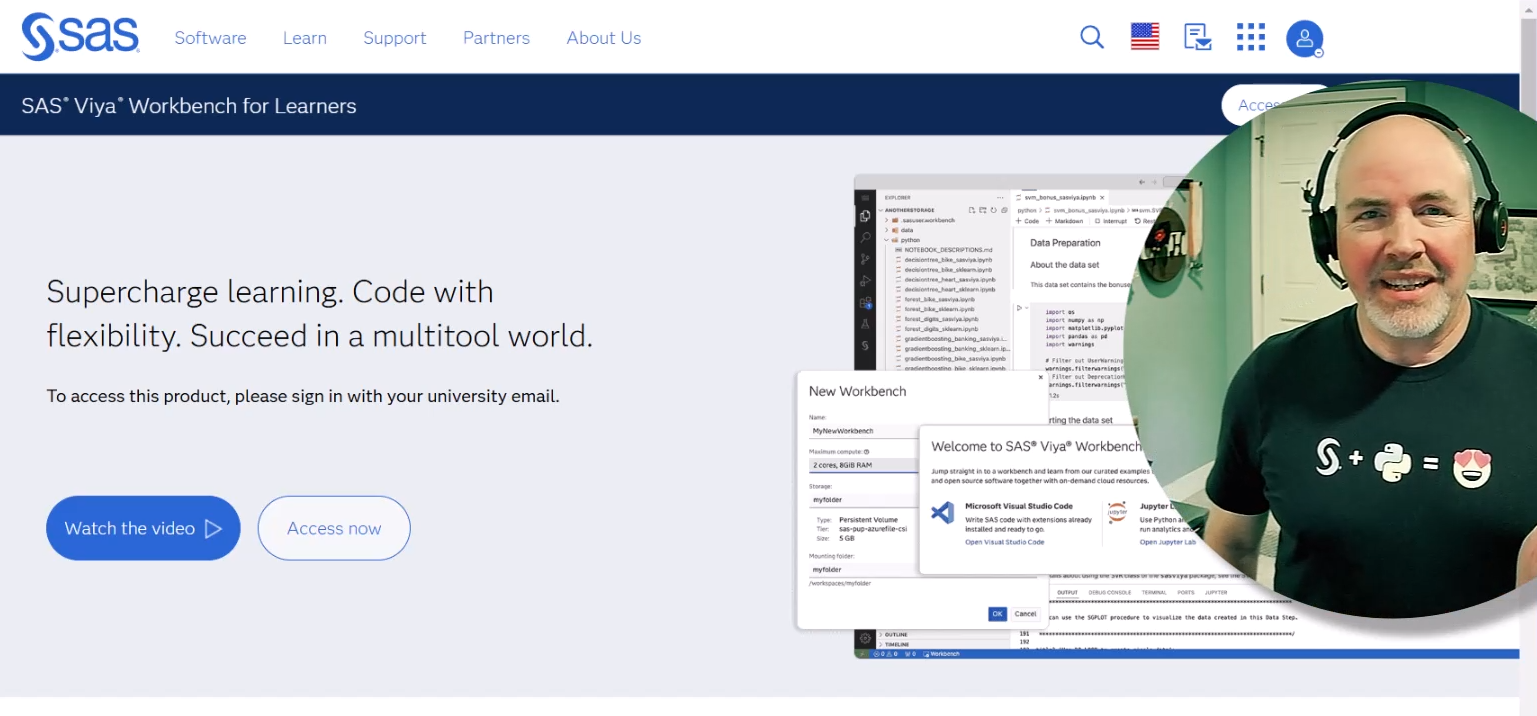
3 SAS Viya Workbench use cases for SAS Users

Review these three cool use cases for SAS users, built using SAS Viya Workbench. SAS and Python for better working together!