Learn about the latest tips, tutorials, upcoming events and certifications
SAS' Leonid Batkhan shows you how to automate creation of SAS variable labels so tables and reports are easier to read.
Learn about the latest tips, tutorials, upcoming events and certifications
SAS' Leonid Batkhan shows you how to automate creation of SAS variable labels so tables and reports are easier to read.
Have you heard that SAS offers a collection of new, high-performance CAS procedures that are compatible with a multi-threaded approach? The free e-book Exploring SAS® Viya®: Data Mining and Machine Learning is a great resource to learn more about these procedures and the features of SAS® Visual Data Mining and
Suppose that a data set contains a set of parameter values. For each row of parameters, you need to perform some computation. A recent discussion on the SAS Support Communities mentions an important point: if there are duplicate rows in the data, a program might repeat the same computation several
A colleague recently posted an article about how to use SAS Visual Analytics to create a circular graph that displays a year's worth of temperature data. Specifically, the graph shows the air temperature for each day in a year relative to some baseline temperature, such as 65F (18C). Days warmer
Um dos principais focos do SAS é entregar, aos clientes, soluções comprovadas e inovadoras que garantam a melhoria do seu desempenho e os ajudem a diferenciar-se dentro da sua área e mercado de atuação. Ajudá-los a tirar o máximo proveito de cada ferramenta faz também parte da missão do SAS,
Are you a statistical programmer whose company has adopted SAS Viya? If so, you probably know that the DATA step can run in parallel in SAS Cloud Analytic Services (CAS). As Sekosky (2017) says, "running in a single thread in SAS is different from running in many threads in CAS."
If you’re a SAS user, you know that SAS Global Forum is where you want to be! It’s our premier, can’t-miss event for SAS professionals—that includes thousands of users, executives, partners and academics. It’s also our largest users’ event, organized by users, for users, and this year’s event marks our
The Johnson system (Johnson, 1949) contains a family of four distributions: the normal distribution, the lognormal distribution, the SB distribution, and the SU distribution. Previous articles explain why the Johnson system is useful and show how to use PROC UNIVARIATE in SAS to estimate parameters for the Johnson SB distribution
You can represent every number as a nearby integer plus a decimal. For example, 1.3 = 1 + 0.3. The integer is called the integer part of x, whereas the decimal is called the fractional part of x (or sometimes the decimal part of x). This representation is not unique.
A SAS programmer wanted to create a graph that illustrates how Deming regression differs from ordinary least squares regression. The main idea is shown in the panel of graphs below. The first graph shows the geometry of least squares regression when we regress Y onto X. ("Regress Y onto X"
In a previous article, I showed how to perform collinearity diagnostics in SAS by using the COLLIN option in the MODEL statement in PROC REG. For models that contain an intercept term, I noted that there has been considerable debate about whether the data vectors should be mean-centered prior to
This blog post demonstrates process and SAS coding techniques to shift dates by a given number of workdays accounting for weekends and holidays.
When I attend a conference, one of the first things I do is look at the agenda. This gives me a good overview of how my time will be spent. The next thing I do is find the detailed breakdown of sessions, so I can start building out my own
I was recently asked about how to interpret the output from the COLLIN (or COLLINOINT) option on the MODEL statement in PROC REG in SAS. The example in the documentation for PROC REG is correct but is somewhat terse regarding how to use the output to diagnose collinearity and how
Are you ready to get a jump start on the new year? If you’ve been wanting to brush up your SAS skills or learn something new, there’s no time like a new decade to start! SAS Press is releasing several new books in the upcoming months to help you stay
Many SAS procedures can automatically create a graph that overlays multiple prediction curves and their prediction limits. This graph (sometimes called a "fit plot" or a "sliced fit plot") is useful when you want to visualize a model in which a continuous response variable depends on one continuous explanatory variable
Last year, I wrote more than 100 posts for The DO Loop blog. The most popular articles were about SAS programming tips for data analysis, statistical analysis, and data visualization. Here are the most popular articles from 2019 in each category. SAS programming tips Create training, testing, and validation data
The next time you pick up a book, you might want to pause and think about the work that has gone into producing it – and not just from the authors.
Bringing the power of SAS to your Python scripts can be a game changer. An easy way to do that is by using SASPy, a Python interface to SAS allowing Python developers to use SAS® procedures within Python. However, not all SAS procedures are included in the SASPy library. So,
The DATA step remains a popular way to create and manipulate SAS data sets. Whether you are reshaping a data set entirely or simply assigning values to a new variable, there are numerous tips and tricks that you can use to save time and keystrokes.
SAS' Leonid Batkhan shows you how to compare SAS data sets that include common and uncommon columns. You'll learn how to check mark commonalities and color-code differences in data tables side-by-side columns and add a comments field to see greater detail.
Recently I showed how to visualize and analyze longitudinal data in which subjects are measured at multiple time points. A very common situation is that the data are collected at two time points. For example, in medicine it is very common to measure some quantity (blood pressure, cholesterol, white-blood cell
If you’re like me, you struggle to buy gifts. Most folks in my inner circle already have everything they need and most of what they want. Most folks, that is, except the tech-lovers. That’s because there’s always something new on the horizon. There’s always a new gadget or program. Or
The SAS Global Certification Program started in 1999 and has issued over 150,000 credentials to SAS users. Today, the program offers 23 different credentials across seven categories.
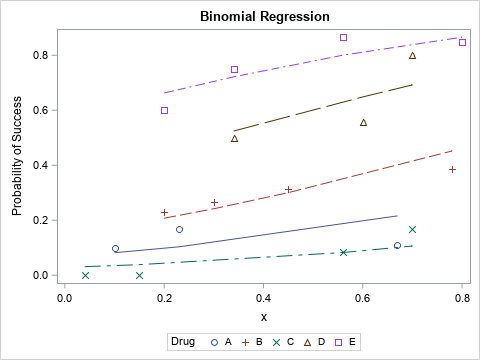
In a linear regression model, the predicted values are on the same scale as the response variable. You can plot the observed and predicted responses to visualize how well the model agrees with the data, However, for generalized linear models, there is a potential source of confusion. Recall that a
The t-test is a very useful test that compares one variable (perhaps blood pressure) between two groups. T-tests are called t-tests because the test results are all based on t-values. T-values are an example of what statisticians call test statistics. A test statistic is a standardized value that is calculated
In grade school, students learn how to round numbers to the nearest integer. In later years, students learn variations, such as rounding up and rounding down by using the greatest integer function and least integer function, respectively. My sister, who is an engineer, learned a rounding method that rounds half-integers
Learn about best-selling SAS author Ron Cody's programming standards.
Understanding multivariate statistics requires mastery of high-dimensional geometry and concepts in linear algebra such as matrix factorizations, basis vectors, and linear subspaces. Graphs can help to summarize what a multivariate analysis is telling us about the data. This article looks at four graphs that are often part of a principal
While growing up in the 80's, I watched The Golden Girls on TV with my Grandma Betty. Now, when my sister visits, we binge watch reruns on TV Land. I was excited when I saw for this Halloween, you could buy Golden Girls costumes! Too bad they sold out right