A SAS/IML programmer asked about the best way to print multiple SAS/IML variables when each variable needs a different format. He wanted the output to resemble the "Parameter Estimates" table that is produced by PROC REG and other SAS/STAT procedures.
This article shows four ways to print SAS/IML vectors in a table in which each variable has a different format. The methods are:
- Use the SAS/IML PRINT statement and assign a format to each column. Optionally, you can also assign a label to each variable.
- Create a SAS/IML table and use the TablePrint statement. You can use the TableSetVarFormat subroutine to assign formats to columns.
- If you want to format the variables according to a SAS/STAT template, you can use the TablePrint subroutine and specify the name of the template.
- Write the vectors to a data set and use PROC PRINT.
An example table
Suppose you have computed a linear regression in the SAS/IML language. You have six vectors (each with three observations) that you want to print in table that resembles the ParameterEstimates table that is produced by PROC REG and other SAS/STAT procedures. Here are the vectors:
proc iml; factors = {'Intercept', 'MPG_Highway','Weight'}; /* Variable */ df = {1, 1, 1}; /* DF = degrees of freedom */ est = {-3.73649, 0.87086, 0.00011747}; /* Estimate */ SE = {1.25091, 0.02446, 0.0001851}; /* StdErr = standard error */ t = {-2.99, 35.6, 0.63}; /* tValue = value t test that the parameter is zero */ pvalue= {0.0029803, 1.36E-129, 0.525902}; /* Probt = two-sided p-value for hypothesis test */ |
The following PRINT statement displays these vectors:
PRINT factors df est SE t pvalue;
However, there are two problems with the output:
- The column headers are the names of the variables. You might want to display more meaningful column headers.
- By default, each vector is printed by using the BEST9. format. However, it can be desirable to print each vector in a different format.
For this table, the programmer wanted to use the same formats that PROC REG uses for the ParameterEstimates table, which are as follows:
- Degrees of freedom (DF) uses the 2.0 format.
- Parameter estimates (Estimate) uses the D11.3 format. (Learn more about the Dw.d format.)
- Standard errors (StdErr) uses the D11.3 format.
- The t statistic (tValue) uses the 7.2 format.
- the p-value (Probt) uses the PVALUE6.4 format. (Learn more about the PVALUEw.d format.)
1. The PRINT statement
IML programmers would use the PRINT statement to print all six columns in a single table. You can use the LABEL= option (or L=, for short) on the PRINT statement to specify the column header. You can use the FORMAT= option (or F=, for short) to specify the format. Thus, you can use the following PRINT statement to create a table in which each column uses its own format:
/* 1: Use PRINT statement. Assign format to each column. You cannot get a spanning header when you print individual columns */ print "-------- Parameter Estimates --------"; print factors[L='Variable'] df[L='DF' F=2.0] est[L='Estimate' F=D11.3] SE[L='StdErr' F=D11.3] t[L='tValue' F=7.2] pvalue[L='Probt' F=PVALUE6.4]; |
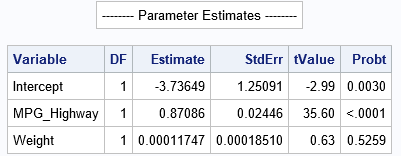
The result is acceptable. The PRINT statement enables you to apply formats to each column. However, unfortunately, there is no way to put a spanning header that says "Parameter Estimates" across the top of the table. This example uses a separate PRINT statement to emulate a header.
2. The TablePrint statement
If you have SAS/IML 14.2 or later (or the iml action in SAS Viya 3.5 or later), you can put the variables into a SAS/IML table and use the TablePrint statement to display the table. The IML language supports the TableSetVarFormat statement. which you can use to set the formats for individual columns, as shown in the following statements:
/* 2: Put variables into a table and use the TABLEPRINT statement. */ Tbl = TableCreate('Variable', factors); call TableAddVar(Tbl, {'DF' 'Estimate' 'StdErr' 'tValue' 'Probt'}, df || est || SE || t || pvalue); call TableSetVarFormat(Tbl, {'DF' 'Estimate' 'StdErr' 'tValue' 'Probt'}, {'2.0' 'D11.3' 'D11.3' '7.2' 'PVALUE6.4'}); call TablePrint(Tbl) ID='Variable' label='Parameter Estimates'; |
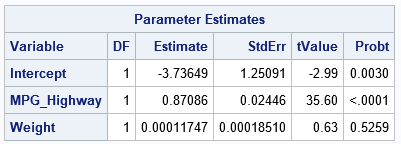
You can see that the TablePrint routine does an excellent job printing the table. You can use the ID= option to specify that the Variable column should be used as row headers. The LABEL= option puts a spanning header across the top of the table.
3. TablePrint can use a template
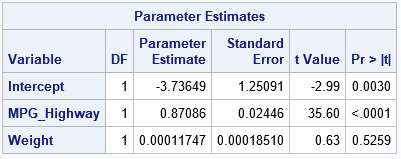
In the previous section, I used the TableSetVarFormat function to manually apply formats to specific columns. However, if your goal is to apply the same formats that are used by a SAS/STAT procedure, there is an easier way. You can use the TEMPLATE= option on the TablePrint subroutine to specify the name of an ODS template. You need to make sure that the names of variables in the table are the same as the names that are used in the template, but if you do that then the template will automatically format the variables and display a spanning header for the table.
/* 3. An easier way to duplicate the ParameterEstimates table from SAS/STAT procedure. Use the TEMPLATE= option. (Make sure the names of variables are what the template expects. */ Tbl = TableCreate('Variable', factors); call TableAddVar(Tbl, {'DF' 'Estimate' 'StdErr' 'tValue' 'Probt'}, df || est || SE || t || pvalue); call TablePrint(Tbl) label='Parameter Estimates' template="Stat.REG.ParameterEstimates"; |
Remember: You can use ODS TRACE ON or the SAS/STAT documentation to find the name of ODS tables that a procedure creates.
4. Use PROC PRINT
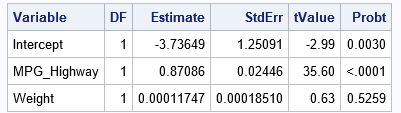
If none of the previous methods satisfy your needs, you can always write the data to a SAS data set and then use Base SAS methods to display the table. For example, the following statements create a SAS data set and use PROC PRINT to display the table. The LABEL statement is used to specify the column headers. The FORMAT statement is used to apply formats to the columns:
/* 4. Write a SAS data set and use PROC PRINT */ create PE var {'factors' 'df' 'est' 'SE' 't' 'pvalue'}; append; close; QUIT; proc print data=PE noobs label; label factors='Variable' df='DF' est='Estimate' SE='StdErr' t='tValue' pvalue='Probt'; format df 2.0 est SE D11.3 t 7.2 pvalue PVALUE6.4; var factors df est SE t pvalue; run; |
Further reading
To learn more about SAS/IML table and other non-matrix data structures, see Wicklin (2017), More Than Matrices: SAS/IML Software Supports New Data Structures."

4 Comments
Rick,
If you are using PROC REPORT ,not PROC PRINT, the output would look better.
proc report data=PE nowd;
label factors='Variable' df='DF' est='Estimate' SE='StdErr' t='tValue' pvalue='Probt';
format df 2.0 est SE D11.3 t 7.2 pvalue PVALUE6.4;
column ('Parameter Estimates' factors df est SE t pvalue);
define _all_/display;
run;
Excellent. Thanks for your contribution.
Can you have SAS IML syntax for small area estimation in mixed model , If you have please forward to me ?
Please use the SAS Support Communities to ask for assistance with SAS programming problems. There is a special community for SAS/IML, if that is relevant to your question.