Last week I showed some features of SAS formats, including the fact that you can use formats to bin a continuous variable without creating a new variable in the DATA step. During the discussion I mentioned that it can be confusing to look at the output of a formatted variable if you don't realize that a format has been applied.
Two formats that sometimes puzzle new SAS programmers are the PVALUEw.d format, which displays p-values, and the ODDSRw.d, which displays odds ratios. These formats appear in many SAS statistical tables. They are the reasons that a table might display a very small p-value or odds ratio with the string "< 0.001." This article describes these formats and explains how to interpret extreme odds ratios.
Formatted p-values and odds ratios
The following call to PROC LOGISTIC displays two tables. One has a column for p-values, the other displays odds ratios:
proc logistic data=sashelp.cars plots=none; where Origin in ("Asia" "USA"); class Type; model Origin = Type MPG_City; ods select ParameterEstimates OddsRatios; ods output ParameterEstimates=PE OddsRatios=OR; run; |
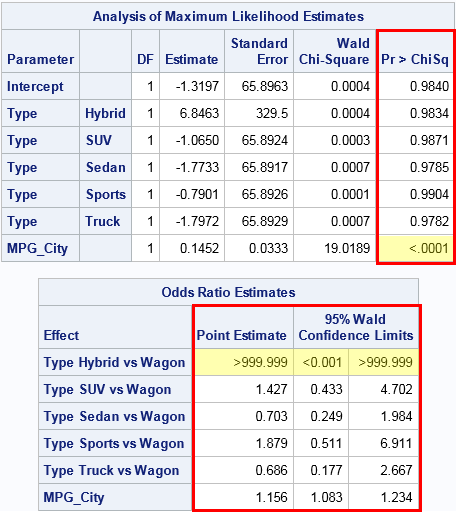
I've overlaid a red rectangle on columns that have special formats. The ParameterEstimates table has a column that is formatted by using the PVALUE6.4 format. The OddsRatios table has three columns that are formatted by using the ODDSR8.3 format.
The cells that are highlighted in yellow show the effect of the formats. In the ParameterEstimates table, the p-value for the MPG_City variable is very small, so it is displayed by using the formatted values "<.0001". In the OddsRatios table, the estimate of the odds ratio for the "Hybrid" vehicles versus the "Wagon" vehicles (the reference level) is very large. It is displayed as ">999.999". Furthermore, the 95% confidence interval for the parameter is displayed as [<0.001, >999.999], which you can interpret as "any value in the interval (0, ∞)."
If you know about these formats, you can interpret the meaning of the highlighted cells. You can always discover the formats used in an ODS table by using the ODS OUTPUT statement to write the tables to a SAS data set and then use PROC CONTENTS to display the variables and formats in the table, as follows:
ods select Position(persist); proc contents data=PE order=varnum; run; proc contents data=OR order=varnum; run; ods select all; |
The PVALUE and ODDSR formats
The PVALUEw.d and ODDSRw.d formats are very simple. Small values are displayed by using a "less than" symbol. Here "small" means less than 10-d, where d is the number of decimals in the format specification. Usually, d=3 or d=4. The ODDSRw.d format has a similar behavior for large numbers. The formatted values are displayed by using the "greater than" symbol.
The following DATA step demonstrates how the PVALUEw.d and ODDSRw.d formats display very small numbers.
data FmtExample(drop=d); do d = -5 to 3; raw = 10**d; oddsRatio = raw; if d<=0 then pVal = raw; /* a p-value must be less than 1 */ else pVal = .; output; end; format raw BEST8. oddsRatio ODDSR8.3 pVal PVALUE6.4; run; options missing=" "; /* display missing values as blanks */ proc print noobs; run; options missing="."; /* reset display of missing values */ |
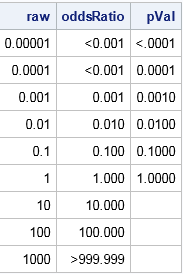
The first column shows the raw unformatted values, which are powers of 10. The second column shows those values formatted by using the ODDSR8.3 format. Values that are less than 10-3 or greater than 103 are displayed by using a less than or greater than symbol. The third column shows the values formatted by using the PVALUE6.4 format. Values that are less than 10-4 are displayed by using a less than symbol.
What does ">999.999" mean for an odds ratio?
For the statistical programmer, the question is not "why is SAS displaying funny-looking numbers," but "what do these numbers tell me about my model and my data?"
For a p-value, small numbers indicate statistical significance. This is usually good. It means that an effect is significant or that there is evidence to reject some null hypothesis.
For an odds ratio, medium-sized numbers appear most often. For example, an odds ratio of 10 (or, equivalently, 1/10) might enable you to conclude that "patients in the experimental group are 10 times more likely to survive than patients in the placebo group." Seeing very large numbers (like 104) or very tiny number (10-4) often indicates that something is wrong. Perhaps your model is misspecified, or perhaps the data is degenerate in some way and does not provide any evidence for or against a statistical hypothesis.
As an example, let's try to understand why the odds ratio is so extreme for the example in this article. The model is trying to predict whether a vehicle is manufactured in Asia or the US. An explanatory factor is the Type variable, and the OddsRatio table indicates something strange about the "Hybrid" level. When using a categorical variable to predict a categorical response, it is often useful to look at the cross-tabulation of the data for the response and explanatory variables:
proc freq data=sashelp.cars; where Origin in ("Asia" "USA"); tables origin * Type / nocum nopercent norow nocol; run; |
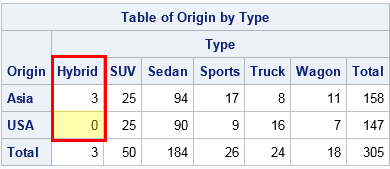
The output from PROC FREQ shows that the "Hybrid" level of the Type variable has only three observations. Furthermore, all three observations are for Asian-manufactured vehicles. The model tries to predict the probability that a car is Asian, given the Type of the car. However, the data indicate that a hybrid car is "infinitely more likely" to be Asian because all hybrid vehicles in the data set are Asian.
If you want a more rigorous explanation, see the PROC LOGISTIC documentation for how the odds ratio is estimated. For this model, the log of the odds ratio equals zero, which makes the odds ratio undefined. If you look in the SAS log, you will see that PROC LOGISTIC issued a warning that something was wrong with the model:
WARNING: There is possibly a quasi-complete separation of data points. The maximum
         likelihood estimate may not exist.
WARNING: The LOGISTIC procedure continues in spite of the above warning. Results
         shown are based on the last maximum likelihood iteration. Validity of
         the model fit is questionable.

5 Comments
Nice post, as usual, Rick. We have a similar P value format in use in my group, but we follow the rule that P values less than .10 are given to three decimal places (with the lowest value being <0.001) and P values greater than .10 are given to two decimal places. It's my belief that P values should never be given to more than 3 decimal places (those differences just aren't meaning ful) and for nonsignificant values (greater than .10) the third decimal is a distraction. Once you get used to scanning P values using this format, it's easy to pick out the "interesting" ones (which have 3 decimal places) and yet you still have the information desired for the P values greater than .10 for interpretation or meta-analyses.
Very interesting! Thanks for writing. I assume you define a custom "picture" format. Care to share it?
Hi Rick thank you for this post! I have a follow-up question about publishing convention.
I made a multivariable logistic regression model where a variable in the model has multiple categories. One of the categories has 0 observations for the outcome of interest. As a result, the 95% CI outputs as 999.99.
What is an accepted convention for typing out that row in my results table for the regression model? This would be for a medical journal. Thank you in advance for your help.
I assume that you are doing some comparison such as the odds that the control group gets a disease as compared to the experimental group.
If no one in the experimental group contracted the disease, then the (empirical) odds are getting the disease in the control group is infinitely greater compared to the experimental group. The infinity is coming from the zero count.
In general, questions about how to present results should be directed to a journal's editor or associate editor. The SAS value "> 999.99" is a shorthand for "very large or infinite."
I love this post. It really helped me to get my P values in proper format !!