The SAS Data Science Blog
Advanced analytics from SAS data scientists
10 things insurance leaders need to know about generative AI and LLMs
SAS' Mary Osborne, Ali Dixon Ricke, and Franklin Manchester break down what insurers still need to learn about generative AI.

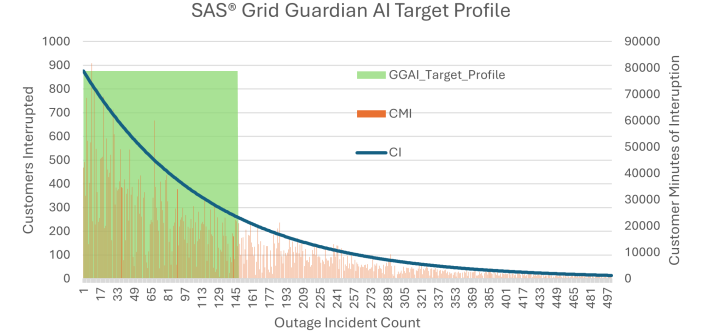
Leveraging the long-tailed nature of power outage impacts as a targeted approach for condition-based maintenance of the overhead distribution grid
As populations around the world the U.S. continue to grow, both condensing in urban areas and sprawling in more rural areas, the importance of a functioning distribution network for utilities grows proportionally. The complexity and interconnected nature of say, the electric distribution network, is already staggering; one can hardly imagine

AI to the rescue: How SAS is fixing food stamp errors and helping families in need
SAS' Shawn Romero introduces you to the SAS Payment Integrity for Food Assistance model.


