Strengthen your programming skills with tips and techniques from the experts
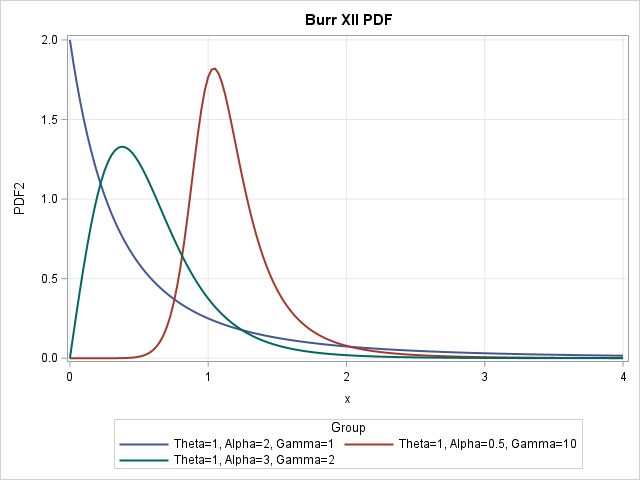
Implement the Burr distribution in SAS

SAS supports more than 25 common probability distributions for the PDF, CDF, QUANTILE, and RAND functions. If you need a less-common distribution, you can implement new distributions by using Base SAS (specifically, PROC FCMP) or the SAS/IML language. This article shows how to use call functions related to the three-parameter