Sometimes it is helpful to display a table of statistics directly on a graph. A simple example is displaying the number of observations and the mean or median on a histogram. In SAS, the term inset is used to describe a table that is displayed on a graph. This article shows four different ways to display a table of statistics on a graph in SAS:
- Some procedures support insets directly by using syntax. This article shows how to use the INSET statement in PROC UNIVARIATE to display summary statistics on a histogram. It also shows how to use the STATS= option to display regression statistics on plots from PROC REG.
- The SGPLOT procedure supports the INSET statement, which enables you to display insets. This article shows how to display two-column insets where the name of the statistic is on the left and the value of the statistic is on the right. First, I show a hard-coded example. Then, I show how to display statistics that are in a SAS data set.
Use the INSET statement in PROC UNIVARIATE
If you are creating a histogram or a panel of histograms, PROC UNIVARIATE supports the INSET statement, which enables you to specify the summary statistics that you want to display on the histogram. You can also control the location of the inset, the text that is display, and the number of decimals displayed.
For example, the following call to PROC UNIVARIATE creates a histogram of the Height variable in the Sashelp.Class data set. You can use the INSET statement to request a table of statistics. In this example, the table will display five sample statistics: N (the sample size), the sample mean, the standard deviation, the minimum value, and the maximum value:
proc univariate data=Sashelp.Class; var Height; histogram Height / grid; inset n mean std min max / pos=NE; run; |
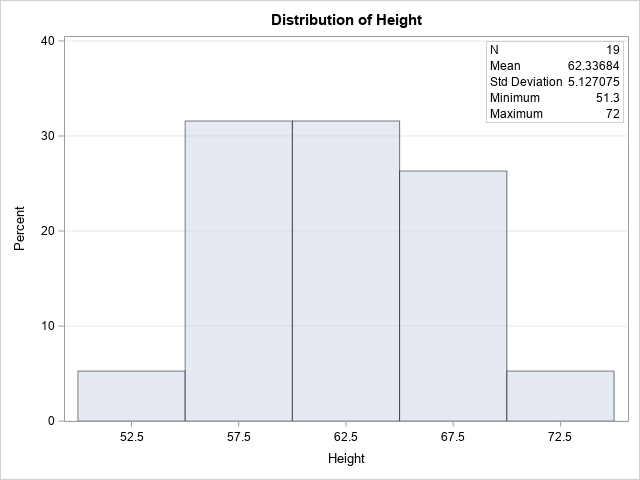
The graph shows the inset and the default labels for the specified statistics. The inset is in the upper right ("northeast") corner of the graph because of the POS=NE option.
The INSET statement enables you to customize the labels and the format for each statistic. For example, suppose you want to change the labels for the N and STD statistic and decrease the number of decimal digits that is displayed for the mean and standard deviation. Suppose, also, that you want the inset in the upper left ("northwest") corner of the graph. The following statements recreate the graph and inset:
proc univariate data=Sashelp.Class; var Height; histogram Height / grid; inset n="Num Obs" mean (5.2) std="Std Dev" (5.2) min max / pos=NW; run; |
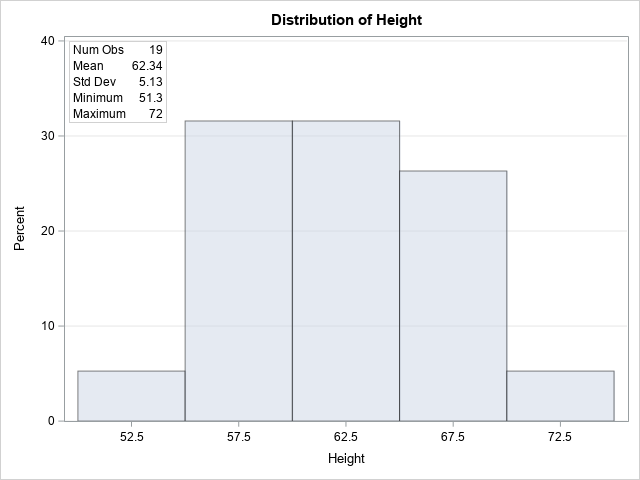
You can see that the inset in the new graph has different labels, format, and location from the inset in the first graph.
Use the STATS= option in PROC REG
A powerful feature of the REG procedure is support for insets. You can use insets to display regression statistics on a fit plot or a diagnostic plot for an OLS regression model.
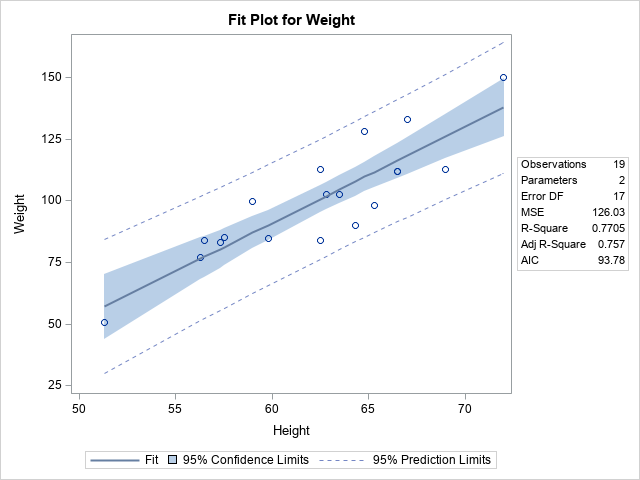
The PROC REG statement supports the PLOTS= option, which you can use to specify the types of graphs to display. After each graph, you can use the STATS= suboption to specify up to 17 common statistics in the inset. I usually choose the DEFAULT suboption, which displays six common statistics, including the number of observations, the number of parameters, and the R-square value. If you want other statistics (for example, the AIC statistic), you can specify them as well. The following call to PROC REG shows the syntax for displaying an inset on a fit plot for a one-variable regression model:
/* PROC REG also supports adding statistics to graphs */ proc reg data=Sashelp.Class plots(only)=FitPlot(stats=(default AIC)); model Weight = Height; quit; |
Use the INSET statement in PROC SGPLOT
Although some SAS procedures include support for insets, many do not. However, the SGPLOT procedure supports the INSET statement, which enables you to display custom insets.
The argument to the INSET statement is a list of values. In this article, I specify the values as name-value pairs, separated by an equal sign. For example, if you want an inset that displays the number of observations in the data, you can specify
inset ("Num Obs"= "19");
Notice that both values are specified as strings.
The simplest way to create an inset is to compute the statistics and copy/paste the values into the INSET statement. For example, the following statements run PROC MEANS to display summary statistics for the Height variable. You can then manually type those values into the INSET statement to display them on a histogram, as follows:
/* compute summary statistics for the Height variable */ proc means data=Sashelp.Class; var Height; run; /* manually specify inset values by hard-coding the output from PROC MEANS */ title "Example of the INSET Statement in PROC SGPLOT"; proc sgplot data=Sashelp.Class; histogram Height; inset("Num Obs"= "19" "Mean" = "62.34" "Std Dev"= "5.13" "Min" = "51.3" "Max" = "72.0") / title="Summary Statistics" position=NE opaque border; yaxis grid; run; |
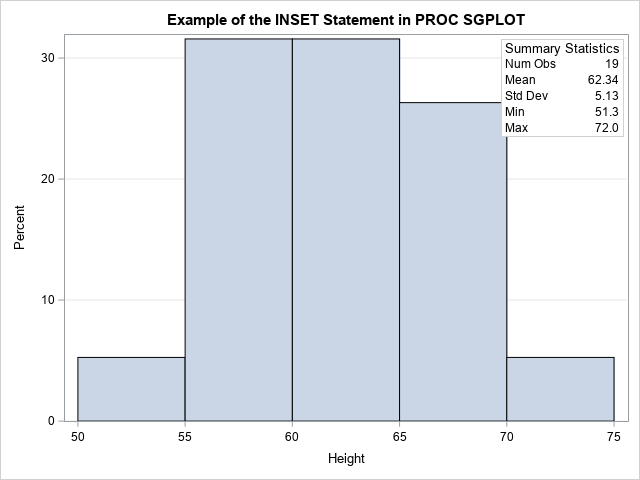
The output is similar to the output from PROC UNIVARIATE. However, the INSET statement works for any plot that you can create by using PROC SGPLOT. Thus, you can add insets to scatter plots, series plots, bar charts, box plots, and more.
Although I do not show it, you can use multiple INSET statements and use the POSITION= option to ensure they do not overlap. For example, you could add a second inset that shows the age range of the students in the data:
inset("Ages:" = "11 - 16") / position=NW border;
Use the INSET statement in PROC SGPLOT with macro variables
In the preceding example, I manually copied and pasted the output from one procedure into the syntax on another procedure. This enabled me to focus on the syntax on the INSET statement. However, in some situations, you might wish to automate this process. For example, if you are creating a report every morning, you probably want to write a program that gets the statistics and automatically inserts them into the INSET statement. This is known as data-driven programming (or, sometime, dynamic programming).
There are several ways to perform data-driven programming, but for this example I will keep the programming simple:
- Use PROC MEANS to write the statistics to a SAS data set.
- Use the DATA step or PROC SQL to read the statistics into SAS macros. This step depends on whether the statistics are in "wide form" (one statistic per column) or "long form" (one statistic per row). Because PROC MEANS writes the statistics in wide form, the following example demonstrate the technique for wide-form data. See a previous article for an example that implements the long-form technique.
- Use the macro variables in the INSET statement.
The following example uses a useful trick: You can use the VNAME function to get the variable name that is associate with a SAS array. By using the VNAME function in conjunction with CALL SYMPUT, you can create SAS macro variables that have the same name as the variables in a data set.
/* automate the inset by using data-driven programming: 1. Write statistics to data set. */ proc means data=Sashelp.Class noprint; var height; output out=OutStats(drop=_TYPE_ _FREQ_) n=N mean=Mean std=StdDev min=Min max=Max; run; /* 2. Data are in wide form: Use VNAME to create a macro that is the same name as the variable */ data _null_; set OutStats; array Stats[*] _numeric_; /* or specify the names of some numeric variables */ do i = 1 to dim(Stats); call symput(vname(Stats[i]), put(Stats[i], BEST5.)); /* macro variable has the same name as the data variable */ end; run; /* 3. Use the macros in the INSET statement */ title "Example of the INSET Statement in PROC SGPLOT"; title2 "Use Macro Variables"; proc sgplot data=Sashelp.Class; histogram Height; inset("Num Obs"= "&N" "Mean" = "&Mean" "Std Dev"= "&StdDev" "Min" = "&Min" "Max" = "&Max") / title="Summary Statistics" position=NE opaque border; yaxis grid; run; |
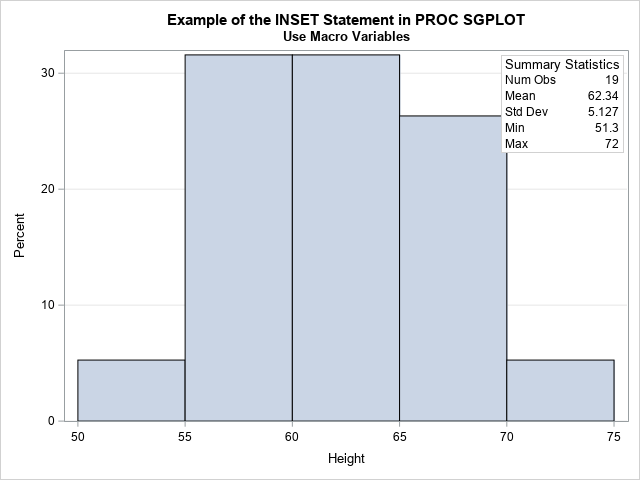
The graph and inset are the same, but the inset is created automatically from the output of PROC MEANS without hard-coding any values or performing any cut-and-paste operations.
Summary
This article shows four examples that display a table of statistics (called an inset) on a graph. Some SAS procedures such as PROC UNIVARIATE and PROC REG have syntax that enables you to create an inset. The advantage of this method is that the procedures compute the statistics and then display them. However, you might need to display a graph by using PROC SGPLOT. In that case, you can use the INSET statement to display an inset on any graph. In the simplest situation, you can hard-code the statistics on the INSET statement. For more advanced reports, I show how to use SAS macro variables to automatically read and display the values of statistics that are in a data set.

2 Comments
Great post as always. Just to add a 5th way, the INSET statement in SGPANEL allows you to use dataset variables without needing to create macro variables. So you can do stuff like:
proc sql ;
create table class as
select *
,mean(height) as meanheight
,mean(weight) as meanweight
from sashelp.class
group by sex
;
quit ;
proc sgpanel data=class ;
panelby sex / rows=1 layout=rowlattice;
scatter x=height y=weight;
inset meanheight meanweight;
by sex ;
run ;
Sometimes even if I don't need a paneled plot, I will create a constant variable to use on the panelby statement, so that I can have data-driven INSET values without macro variables. That said, the macro variable approach gives you full control over formats etc.
Yes, true. For example, here is the article's example by using PROC SGPANEL:
I explicitly set the size of the graph because otherwise PROC SGPANEL uses default sizes that are suited for multiple panels.