SAS Public Sector's Elena Shtern is your guide as you extract data from the Federal Reserve Economic Data site using the SASEFRED interface engine, part of SAS/ETS® software.
I had the pleasure of speaking at the inaugural “Accounting IS Big Data” conference this past week in New York City, a meeting organized by the American Accounting Association. In addition to giving several talks, I participated in breakout sessions in which attendees discussed how analytics is used to monitor
SAS has several procedures that can fit a probability distribution to data, plot a histogram, and overlay one or more density estimates: PROC UNIVARIATE in Base SAS enables you to overlay parametric density curves from about 20 common continuous probability distributions, such as normal, lognormal, and gamma. It also enables
SAS provides procedures to fit common probability distributions to sample data. You can use PROC UNIVARIATE in Base SAS or PROC SEVERITY in SAS/ETS software to estimate the distribution parameters for approximately 20 common distributions, including normal, lognormal, beta, gamma, and Weibull. Since there are infinitely many distributions, you may
SAS software supports two kinds of procedures: interactive and non-interactive. Most SAS procedures are non-interactive. They begin with a PROC statement, include one or more additional statements, and end with a RUN statement. When SAS encounters the RUN statement, the procedure executes all statements, then exits. On the other hand,
Batch manufacturing involves producing goods in batches rather than in a continuous stream. This approach is common in industries such as pharmaceuticals, chemicals, and materials processing, where precise control over the production process is essential to ensure product quality and consistency. One critical aspect of batch manufacturing is the need to manage and understand inherent time delays that occur at various stages of the process.
SoDA를 이용해 쉽게 배우는 데이터 과학 #1 SoDA(SAS OnDemand for Academics)는 SAS가 무료로 제공하는 교육용 데이터 분석 소프트웨어 프로그램입니다. 앞으로 4회에 걸쳐 'SoDA 를 이용해 쉽게 배우는 데이터 과학'을 자세히 소개해 드리도록 하겠습니다. SoDA란? SoDA (SAS OnDemand for Academics; SoDA)는 데이터 과학을 처음 배우는 입문자들에게 SAS를 무료로 배울 수 있도록
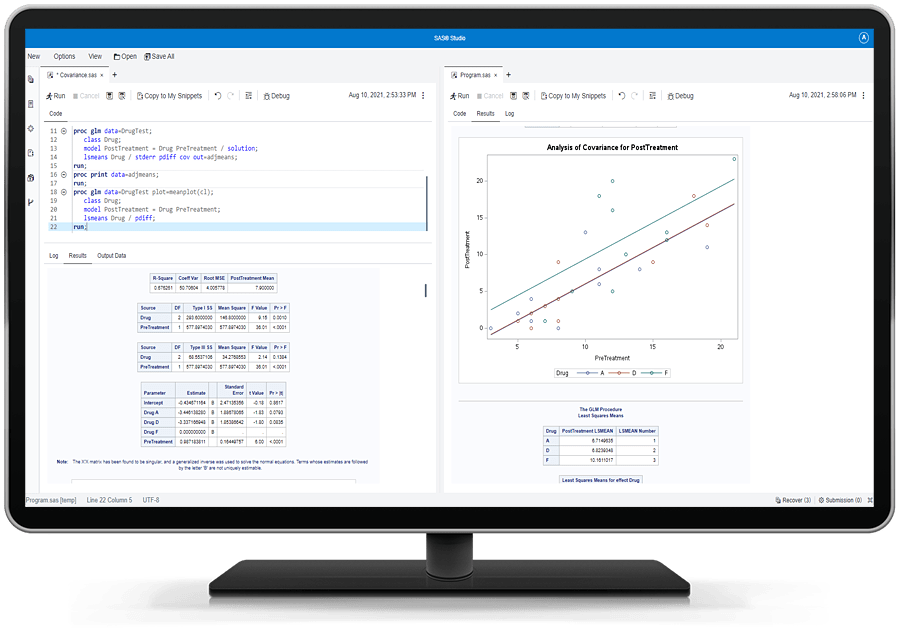
2023年を迎えて間も無く1ヶ月が経とうとしていますが、皆様はどのよう新年のスタートをされましたでしょうか。With コロナに向けた取り組みが社会的には広がり、自らが管理する時間が増えた中で、質の良い学習時間を確保することは社会人・学生問わず大変重要なことかと思います。 さて、SASでは学習および教育を目的とする方向けに、SAS® OnDemand for Academics (ODA) というアナリティクス・ソフトウェアを無料で提供しています。実は、このSAS ODAですが昨年末にログイン画面のアップグレードが行われ、提供されている各種機能へのアクセス方法がわかりやすくなりました。このブログ記事では、アップグレード後の SAS ODAについて紹介していきます。 ①ホーム画面(中央) 画面中央には大きく3つのセクションがあり、それぞれ下記の内容が提供されています。 Code with SAS® Studio すべての教員・学生・個人学習者を対象として、Webサイトにアクセスするだけで使用可能です 提供されている”タスク”からGUI的にSASコードを生成可能です(もちろん自分でコーディングすることも可能) SAS Studio上にプログラムファイルの新規作成、既存ファイルのアップロードが可能です(最大5GB) アクセス可能なSASソフトウェア一覧: SAS/STAT® Base SAS® SAS/IML® SAS/OR® SAS/QC® SAS/ETS® Learn SAS Programming Programming 1, Statistics 1といった統計学やプログラミングに関するいくつかのe-learningや、動画教材を提供しています SASソフトウェアや統計解析・機械学習を中心とした基礎的な知識、スキルをe-learningを通じて習得可能なオンライン学習プラットフォームSAS Skill Builder for Studentsを学生を対象として提供しています(大学ドメインのアドレスが必要) SASの認定資格に関するガイドをていきょうしています Collaborate with SAS Communities いくつかのSASに関連するコミュニティ情報が掲載されています プログラミングや解析にあたっての疑問点、Tipsを共有し、世界中のSASユーザーからコメントをもらうことが可能です ②ホーム画面(右) 初期状態では次の5つのアイコンが表示されます。 Files
SAS Analytics Pro Advanced Programming offers key statistical capabilities in a docker container. The product bundles selected executables from SAS Viya to create the container, which eases or streamlines the setup required for fixes and updates to the software.
An experienced SAS programmer recently switched to SAS Viya and asked how to discover what products are available on his version of Viya. We discussed a few older SAS 9 procedures, and I showed him a new Viya-specific way to get information about his version of SAS and his licensed
SAS' Kelly Fellingham, an advanced analytics software developer, reveals how SAS software's new SASEBEA interface helps you identify patterns in US economics data.
When SAS 9 programmers transition to SAS Viya, there are inevitably questions about how new concepts in Cloud Analytic Services (CAS) relate to similar concepts in SAS. This article discusses the question, "What is the difference between a libref and a caslib?" Both are used to access data, but they
I attended a seminar last week whose purpose was to inform SAS 9 programmers about SAS Viya. I could tell from the programmer's questions that some programmers were confused about three basic topics: What are the computing environments in Viya, and how should a programmer think about them? What procedures
SAS' Rajesh Selukar introduces you to a new scoring feature.
SAS' Xilong Chen introduces the new DEEPCAUSAL procedure in SAS Econometrics for causal inference and policy evaluation and much more.
After my recent articles on simulating data by using copulas, many readers commented about the power of copulas. Yes, they are powerful, and the geometry of copulas is beautiful. However, it is important to be aware of the limitations of copulas. This article creates a bizarre example of bivariate data,
In general, it is hard to simulate multivariate data that has a specified correlation structure. Copulas make that task easier for continuous distributions. A previous article presented the geometry behind a copula and explained copulas in an intuitive way. Although I strongly believe that statistical practitioners should be familiar with
Do you know what a copula is? It is a popular way to simulate multivariate correlated data. The literature for copulas is mathematically formidable, but this article provides an intuitive introduction to copulas by describing the geometry of the transformations that are involved in the simulation process. Although there are
It is well known that classical estimates of location and scale (for example, the mean and standard deviation) are influenced by outliers. In the 1960s, '70s, and '80s, researchers such as Tukey, Huber, Hampel, and Rousseeuw advocated analyzing data by using robust statistical estimates such as the median and the
When data contain outliers, medians estimate the center of the data better than means do. In general, robust estimates of location and sale are preferred over classical moment-based estimates when the data contain outliers or are from a heavy-tailed distribution. Thus, instead of using the mean and standard deviation of
Note from Udo Sglavo: In our peace of mind blog series, we documented areas of analytics that are either evolving or not necessarily in the standard toolset of data scientists. We looked at causal modeling, network analytics, and econometrics, to name a few. With this blog post, we would like
A note from Udo Sglavo: When people ask me what makes SAS unique in the area of analytics, I will mention the breadth of our analytic portfolio at some stage. In this blog series, we looked at several essential components of our analytical ecosystem already. It is about time to
For ordinary least squares (OLS) regression, you can use a basic bootstrap of the residuals (called residual resampling) to perform a bootstrap analysis of the parameter estimates. This is possible because an assumption of OLS regression is that the residuals are independent. Therefore, you can reshuffle the residuals to get
Finding the root (or zero) of a nonlinear function is an important computational task. In the case of a one-variable function, you can use the SOLVE function in PROC FCMP to find roots of nonlinear functions in the DATA step. This article shows how to use the SOLVE function to
Forecasting with SAS®: Special Collection SAS Press has added to its selection of free downloadable eBooks with the new Forecasting with SAS®: Special Collection. From the description: Want to get the most insight out of your data and improve the quality of your forecasts? SAS offers many different solutions to
If you're close to my age, you probably remember Joe Walsh's song Ordinary Average Guy. That song popped into my head when I was writing this example about moving averages, so I encourage you to listen to it while reading the blog post. Many people are looking at graphs lately
SAS programmers sometimes ask about ways to perform one-dimensional linear interpolation in SAS. This article shows three ways to perform linear interpolation in SAS: PROC IML (in SAS/IML software), PROC EXPAND (in SAS/ETS software), and PROC TRANSREG (in SAS/STAT software). Of these, PROC IML Is the simplest to use and
Bringing the power of SAS to your Python scripts can be a game changer. An easy way to do that is by using SASPy, a Python interface to SAS allowing Python developers to use SAS® procedures within Python. However, not all SAS procedures are included in the SASPy library. So,
A moving average is a statistical technique that is used to smooth a time series. My colleague, Cindy Wang, wrote an article about the Hull moving average (HMA), which is a time series smoother that is sometimes used as a technical indicator by stock market traders. Cindy showed how to
The CUSUM test has many incarnations. Different areas of statistics use different assumption and test for different hypotheses. This article presents a brief overview of CUSUM tests and gives an example of using the CUSUM test in PROC AUTOREG for autoregressive models in SAS. A CUSUM test uses the cumulative