
최근 국내 의료진이 정상적인 인지 기능을 가진 노인이 알츠하이머 치매에 걸릴 가능성을 예측할 수 있는 새로운 분석 지표를 개발해 큰 주목을 받았습니다. 세계적인 신경 과학 학술지 ‘사이언티픽 리포트(Scientific Reports)’에 소개되며 치매 발병에 대한 예방적 조치를 할 수 있을 것으로 기대를 모으고 있는데요. 많은 과학자들이 오늘날 초고령화 사회에서 가장 두려운 질병 중

최근 국내 의료진이 정상적인 인지 기능을 가진 노인이 알츠하이머 치매에 걸릴 가능성을 예측할 수 있는 새로운 분석 지표를 개발해 큰 주목을 받았습니다. 세계적인 신경 과학 학술지 ‘사이언티픽 리포트(Scientific Reports)’에 소개되며 치매 발병에 대한 예방적 조치를 할 수 있을 것으로 기대를 모으고 있는데요. 많은 과학자들이 오늘날 초고령화 사회에서 가장 두려운 질병 중
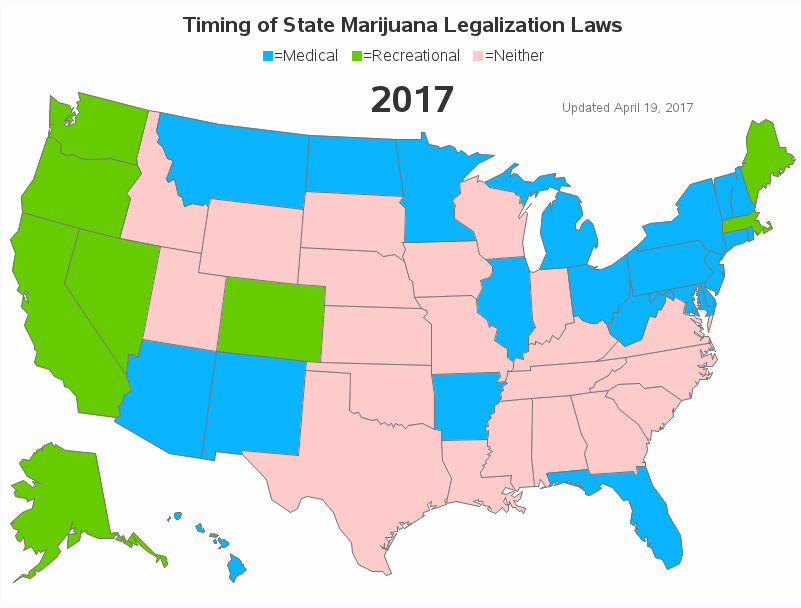
Whether or not to legalize marijuana is a hotly debated topic these days. And no matter which side of the debate you're on, I think you will be interested in seeing several ways to visualize which states have legalized marijuana, and when ... Their Version Here's the original graph that
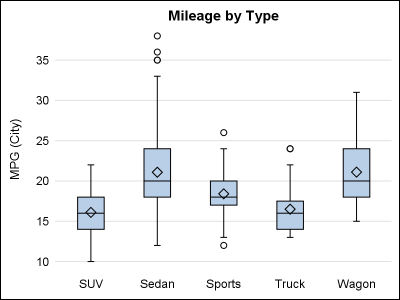
The SG procedures and GTL statements do a lot of work for us to display the data using the specified statements. This includes setting many details such as arrow heads, line patterns etc, including caps. Often, such details have a fixed design according to what seems reasonable for most use

Blockchain technology and payment integrity in health care Blockchain technology has arrived in the health care space, bringing anticipation of revolutionary change in operational efficiency, data management, security, fraud prevention, disease prevention, and perhaps even in payments. While these are not new goals, I am ever the optimist. As almost
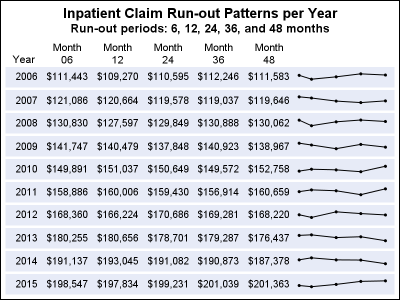
In the previous post, I discussed creating a 2D grid of spark lines by Year and Claim Type. This graph was presented in the SESUG conference held last week on SAS campus in the paper ""Methods for creating Sparklines using SAS" by Rick Andrews. This grid of sparklines was actually the

This year, CEO Jim Goodnight released our new “Core Values.” Authentic, Accountable, Curious, and Passionate were the words chosen to describe SAS, influence our work here, and showcase who we are as a company. While these values can and will certainly guide our actions in the workplace, I couldn’t help
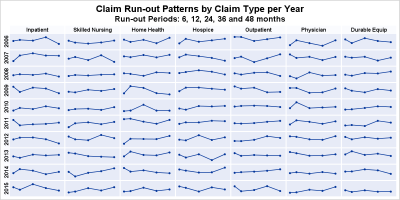
The 25th annual SESUG conference was held at in the SAS campus this week. I had the opportunity to meet and chat with many users and attend many excellent presentations. I will write about those that stood out (graphically) in my view. One excellent presentation was on "Methods for creating

I recently saw an alarming article on social media about an outbreak of airborne plague spreading from Madagascar to Africa (and potentially to the rest of the world). The plague?!? - I thought that only happened hundreds of years ago?!? I don't really trust news on Facebook, so I went
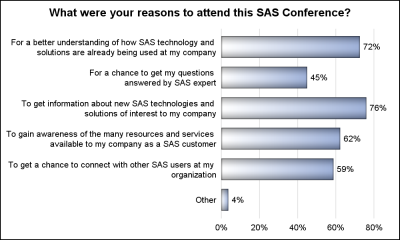
The South East SAS Users Group meeting wound up yesterday. The 25th anniversary conference was held on SAS Campus and it provided a great opportunity to meet with many enthusiastic SAS users and attend many informative presentations. More on this in a follow-up article. During one of these presentations, Mary
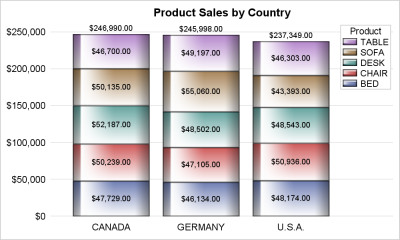
Once in a while you run into a pesky situation that is hard to overcome without resorting to major surgery. Such a situation occurs when you have a stacked bar chart with a discrete legend positioned vertically on the side of the graph. A simple example is shown below. title
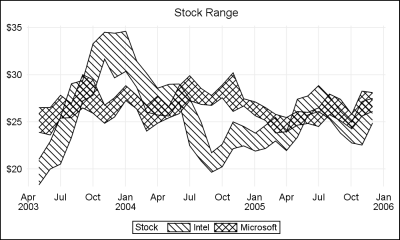
When a plot is classified by one or more variables, the different classes values are displayed in the graph either by position or by using different plot attributes such as color, marker shape or line pattern. For plots that display the visual by a filled area (bar, bin, band, bubble,
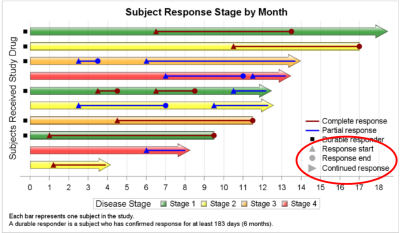
Plot statements included in the graph definition can contribute to the legend(s). This can happen automatically, or can be customized using the KEYLEGEND statement. For plot statements that are classified by a group variable, all of the unique group values are displayed in the legend, along with their graphical representation

Todos conocemos el caso de alguien que amamos o que es parte de nuestra vida y que tiene una enfermedad o un tipo de cáncer. En el mundo cada día se registran nuevos casos de esta enfermedad, entre los principales se encuentran: pulmón, estómago, hígado, colon y mamá. De los
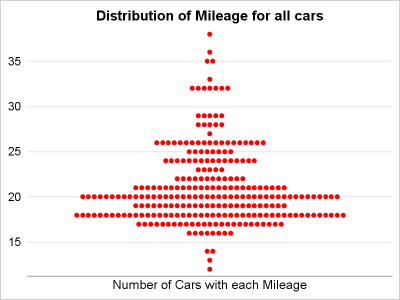
Last year, a user asked about creating a "Turnip Plot" as used in this study of Caesarian Section Rates. Primarily, this is similar to a histogram on the y-axis for each unique value on the y-axis. A marker is drawn for each occurrence, starting from the center. Back then, I
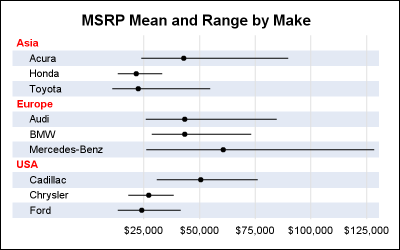
The previous post on Multiple Blank Categories showed how to include multiple blank categories on the axis. But, given the purpose for this was to separate different segments in the data, I also included ideas on how to segmented a discrete axis using reference lines or Block Plot. A similar idea

My father introduced me to Gene Kelly and Donald O’Connor when I was 10… in a figurative sense. Dad loved musicals and Singin’ In The Rain became one of my favorites. I was obsessed with their tap dance to Moses Supposes and practiced every day after school until I ‘got

Este 19 de octubre se celebra el día internacional contra el cáncer de mamá y hoy la analítica está contribuyendo a salvar la vida de muchas mujeres que padecen esta terrible enfermedad, un ejemplo de superación. Susan Weidner, vicepresidente sénior de IntrinsiQ Specialty Solutions. Susan fue diagnosticada con cáncer de
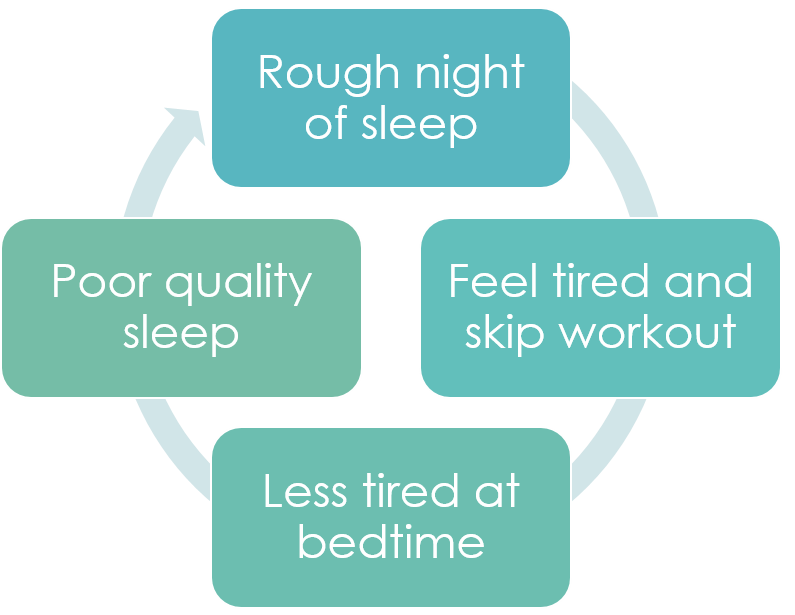
My sons were amazing sleepers...as babies. Around age 2.5, mutiny ensued. My eldest endured the wild combination of potty training, a new baby brother, transitioning into a "big boy" bed, and a beautiful developing imagination. While the youngest didn’t have the new baby to taunt his sleep, he did get
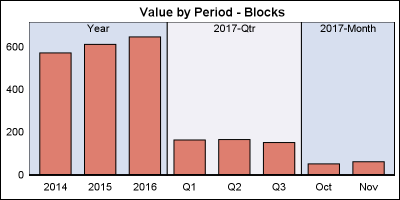
Off and on, users have expressed the need to include multiple blank categories on a discrete axis. Often, this is desirable to separate groups of bars (or categories) in a graph due to some difference their definition. Such a case was discussed in this blog article on using non breaking
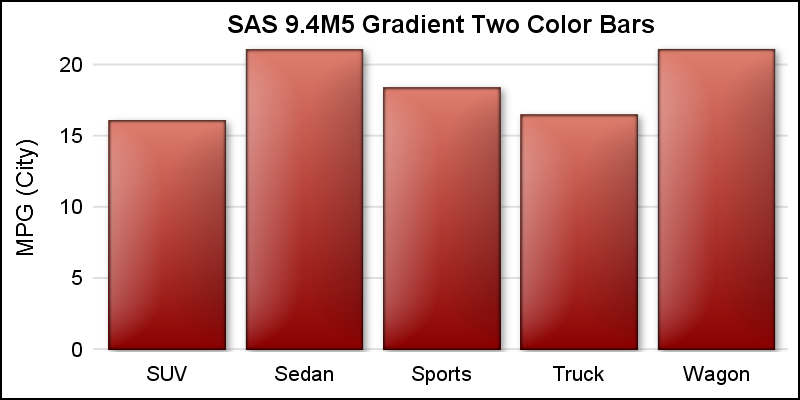
ODS Graphics procedures primarily strive towards the following goal: "Make simple graphs easy and complex graphs possible". SGPLOT procedure allows you create simple graphs with a single plot statement, and create complex graphs by layering together or combining multiple plot statements. Generally, the appearance follows the guidelines set by industry
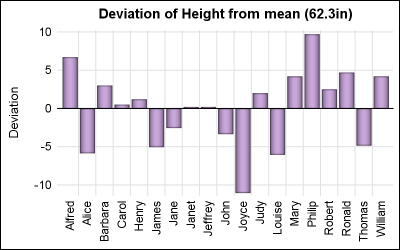
SAS 9.4 maintenance release 5 was released on Sept 19, 2017. This release includes many new items including integration with SAS Viya and SAS Studio, a web application for SAS development. Also Included with this release are some cool new features in the graphics domain, some of which were requested
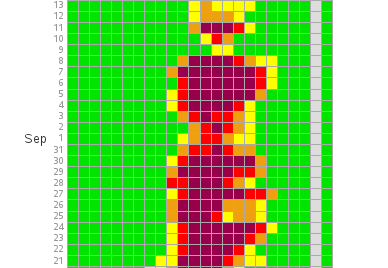
The movie Blade Runner came out about 30 years ago, portraying a dystopian future set in 2019 Los Angeles. Many of the technology predictions in the movie have actually become reality - but how about the weather and pollution? The movie was all about smog and a lack of sunshine, and I wondered

I have a busy life. Did I sign up for it? You bet! Now I’m trying to balance it all and do it well. I’m a mom first and foremost. Being a parent is the most important job someone can take on. Raising the next generation is no easy task
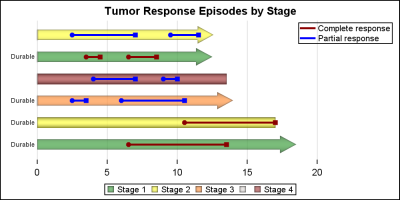
On a recent visit to an In-House Users Group meeting at a Pharmaceutical company, I presented a 1/2 day seminar on creating Clinical Graphs using SG Procedures. Polling the audience for their experience with these procedures indicated that many SAS users are not familiar with these new ways to create graphs. So,

Healthcare, like many industries, is in the midst of a paradigm shift, says Chris Donovan, Executive Director of Enterprise Information Management & Analytics for the Cleveland Clinic. "Historically, healthcare was really about intervention, and about taking care of you when you were sick and getting you better." That type of care

12 hours: That’s how quickly you can die from sepsis. Oh – you’ve never heard of sepsis? Not surprising. More Americans have heard of Ebola, a nearly non-existent condition in the U.S., than sepsis – a condition that affects more than 1.6 million Americans every year. Sepsis is the body’s

La lucha contra el VIH no es sinónimo de reportes interactivos o cuadros de mando, probablemente tampoco se ligue a servicios de comida para pacientes con cáncer o servicios de asistencia médica. CrescentCare ha hecho esfuerzos importantes para mejorar los servicios de salud, una pieza elemental en este esfuerzo es

Die EU-Datenschutz-Grundverordnung kommt näher – ausweichen oder draufhalten? In den letzten Wochen hatte ich die tolle Gelegenheit mit zahlreichen Kunden und Partnern über die neue EU-Datenschutz-Grundverordnung (DS-GVO) zu sprechen. Die Meinungen und Erwartungen sind dabei wirklich außerordentlich breit gefächert. Das ist nicht weiter verwunderlich, denn das Thema hat zuletzt stark an

How to “Mind your Mind” and Improve your Well-being This morning you woke up, started your day and, whether you realized it or not, you said some things to yourself. You may have said, Today is going to be great… I am going to succeed… I look good! or perhaps

El aumento desmesurado de los datos y la latente necesidad de aprovecharlos para tomar mejores decisiones, ha llevado a que soluciones como las de la analítica no solo estén al servicio del crecimiento de los negocios, sino que tengan un alto impacto en la calidad de vida de las personas