When a plot is classified by one or more variables, the different classes values are displayed in the graph either by position or by using different plot attributes such as color, marker shape or line pattern. For plots that display the visual by a filled area (bar, bin, band, bubble, etc), the classification could be represented by a fill color or an outline using line patterns (may not always very effective).
Often you have to submit figures or graphs with your presentation in PDF format to journals or agencies that require the graphs be rendered in black and white, or gray scale, but not in color. For such output, ODS Graphics provides built-in SAS Styles called JOURNAL, JOURNAL2 and JOURNAL3. JOURNAL2 is a pure black and white style that also specifies the fill patterns that are used for group classification.
For a while now, users have requested support of fill patterns for all plots that represent data using filled areas. While this may appear to be "old school", it is indispensable in some cases. Since SAS 9.3, the bar charts in GTL and SGPLOT have supported fill patterns. Now, with the release of SAS 9.40M5, all plots that display data using filled areas support fill patterns for group classification. Here are some examples.
Note: Full code for all examples is linked at the bottom of the page.
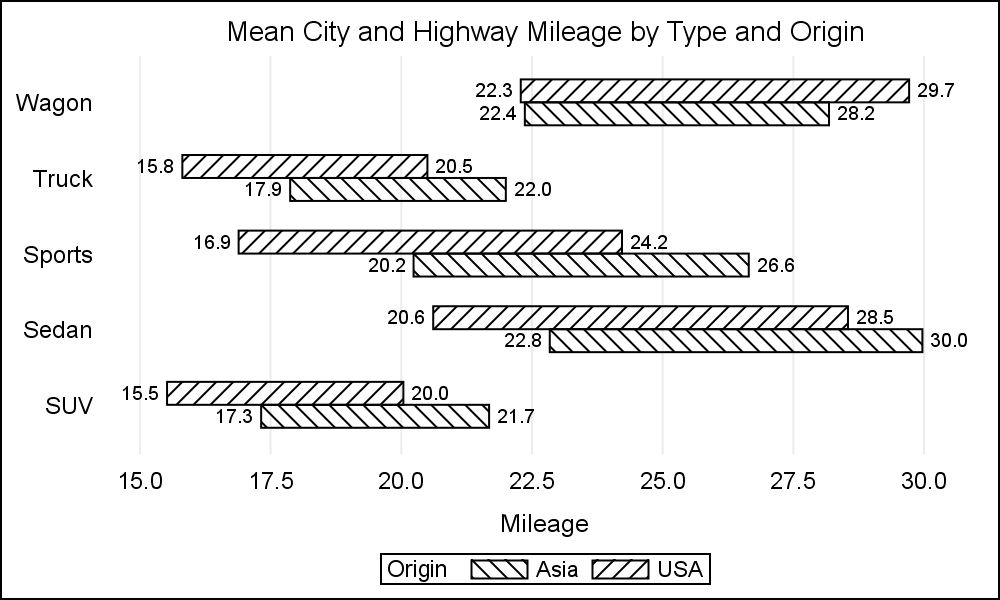
Bar Chart.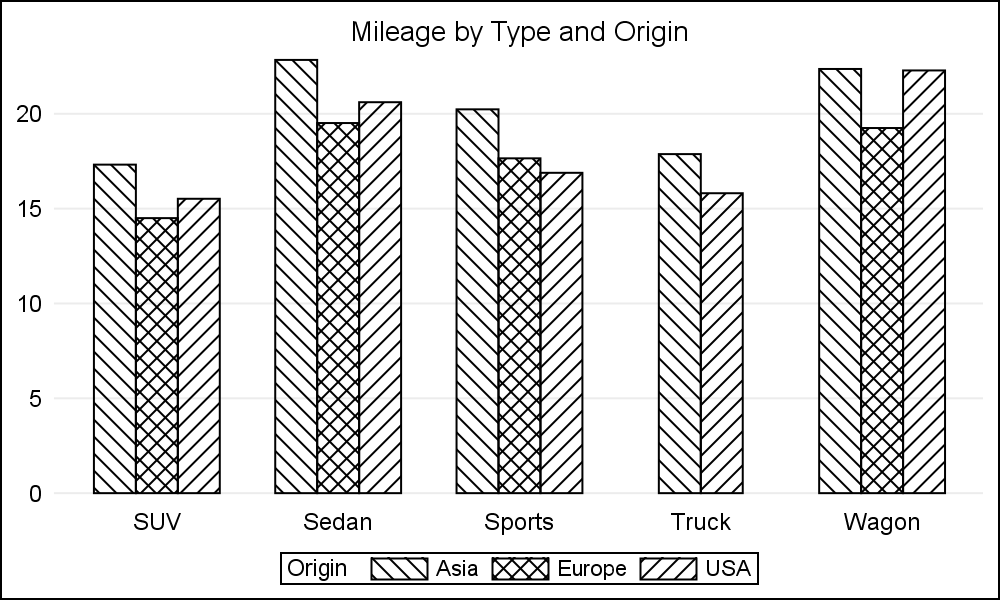
Note the visual effect of placing the bars with pattern fills side by side that makes them appear to "lean towards" the middle. This is merely a visual effect, and actually, the bars are quite straight and rectangular.
Band Plot.
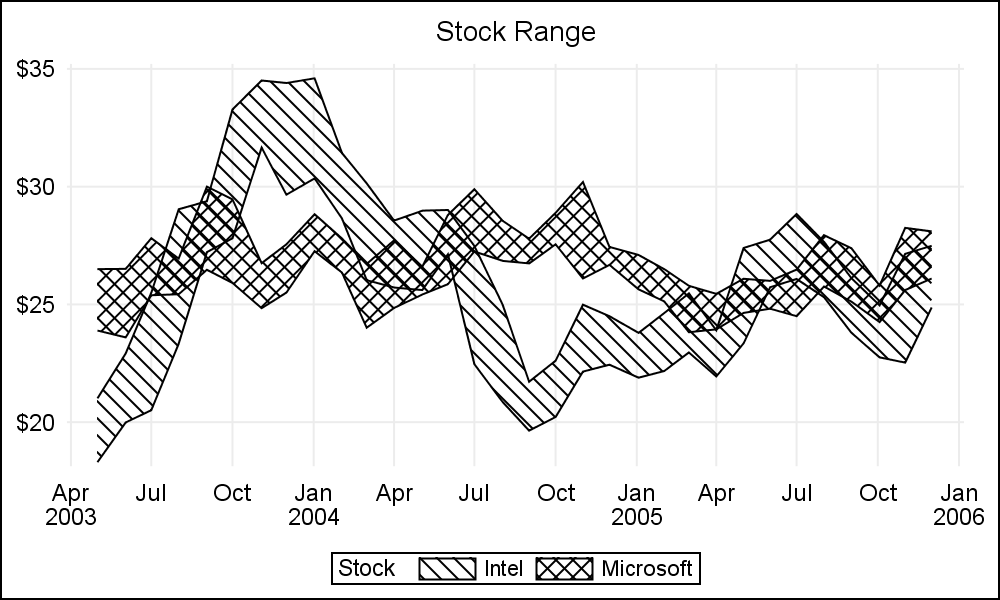 The fill types for each group value are derived from the Style Elements GraphData1 - GraphData12. Along with colors, markers and line patterns, these elements in the JOURNAL2 style also include the fill types. These are denoted with the names "L1", "R1", "X1" and so on. The display attribute for fill patterns is also enabled.
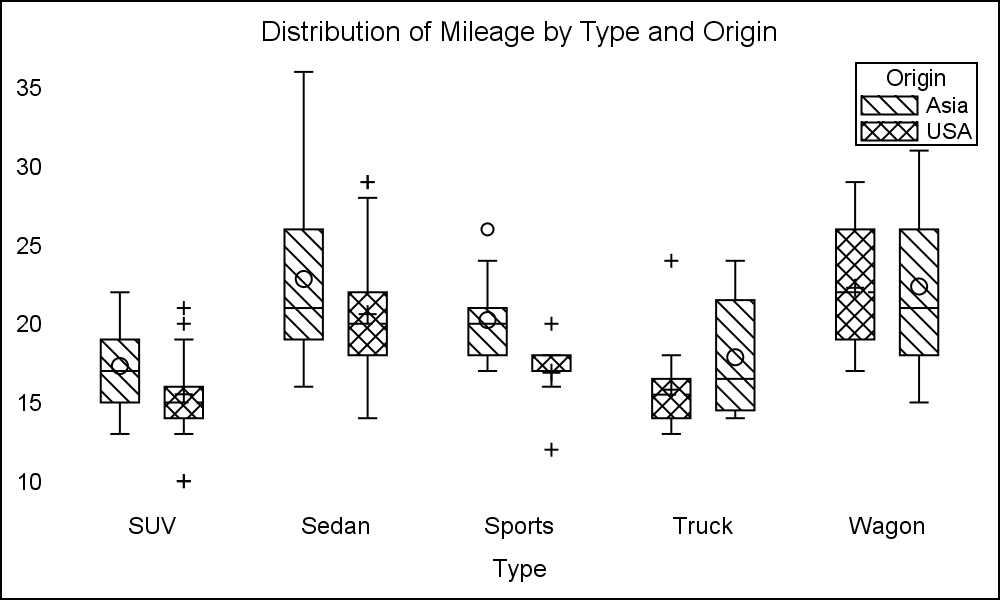 Box Plot.
For the VBOX, the whiskers are displayed using different line patterns. In the absence of fill patterns, the line patterns and the mean marker shape denote the group classification. With fill patterns, I like to display the whisker using the solid line pattern. This can be done by setting the WHISKERATTRS option.
 Bubble Plot
One thing I noticed with the bubble plot was the AUTOITEMSIZE for making the bubbles in the legend proportional to the text size did not seem to work. Something for us to follow-up on.
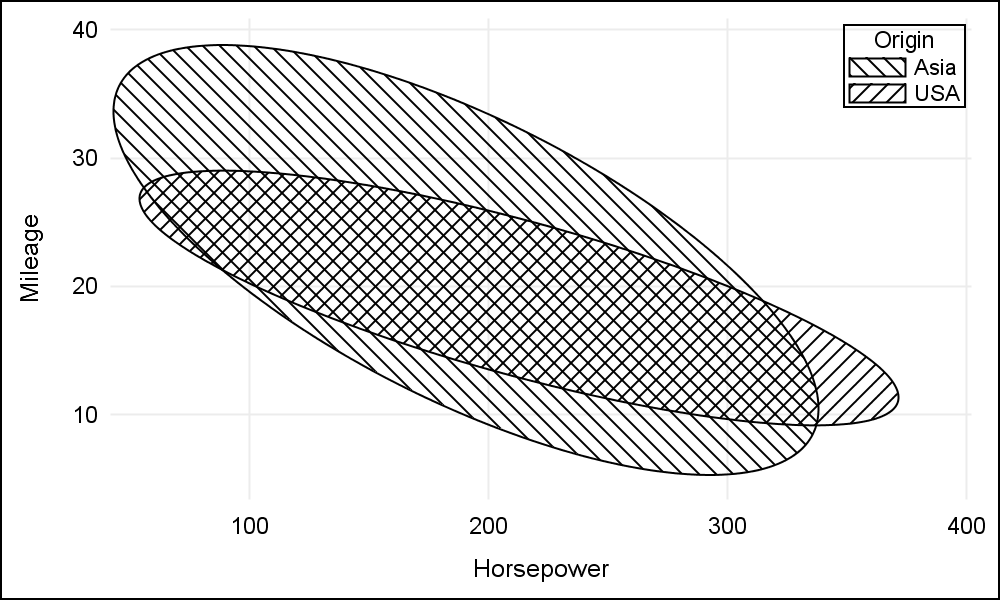 Ellipse Plot
I reduced the number of class levels to two for clarity. Also, you can use the STYLEATTRS statement to set the fill patterns you want to use with the groups. Discrete attribute maps also support fill patterns.
 HighLow Plot
Similar to a bar chart or a box plot.
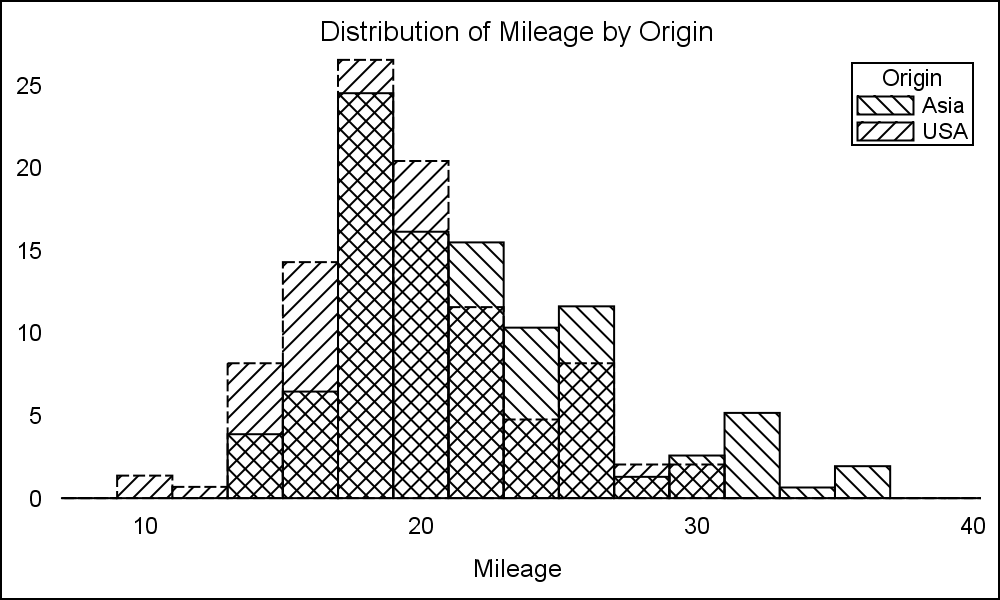 Histograms
Groups will use different fill patterns, as will multiple overlays.
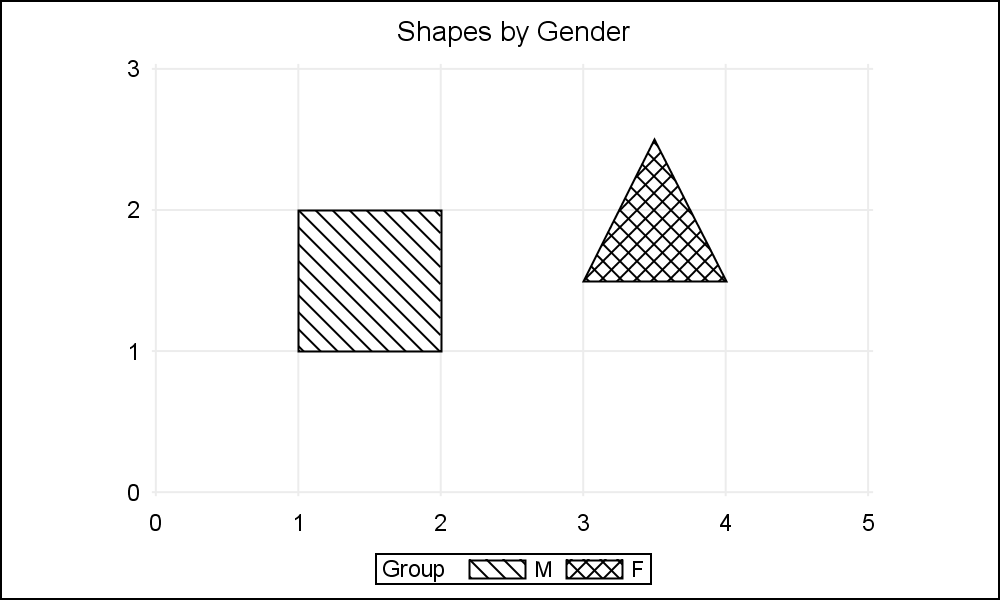 Polygon Plot
The polygon plot is very versatile, and allows you to render any polygonal shape that you can define as a polygon with (x, y) vertex data. Polygons can have text labels and can be used to render maps from map data set.
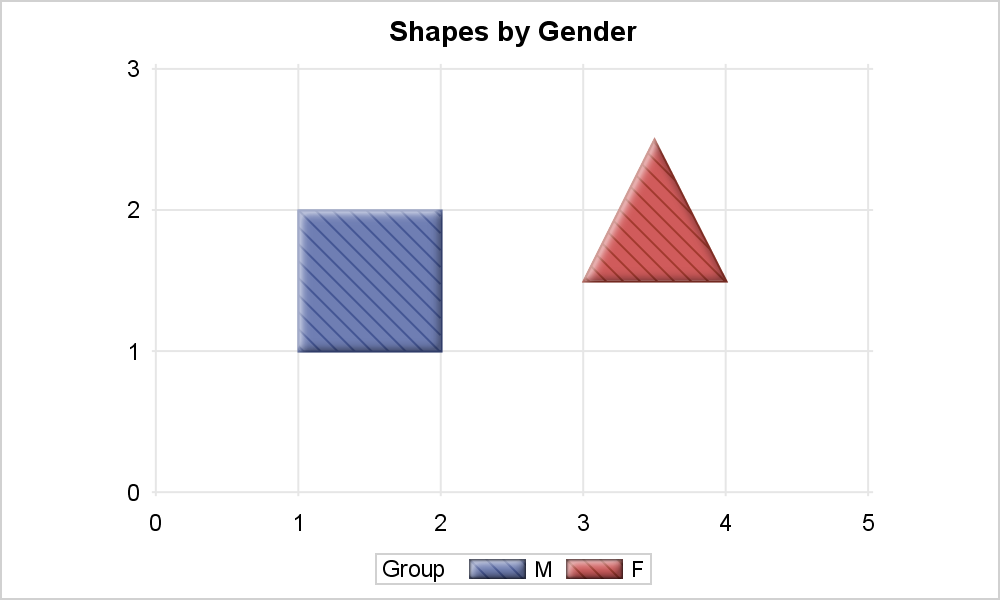 Fill patterns can also be used with fill colors and data skins for special effects.
When using skins or fill patterns, the visual element in the legend is made a bit bigger to allow the display of the pattern. This can be customized by using various legend options.
While I did not cover every version of every plot, all vertical and horizontal versions of these plot statements will support fill patterns.
SAS 9.40M5 SGPLOT Code: Fill_Patterns


2 Comments
I have a waterfall plot that uses vbarparm and I have three visits per subject clustered together is there a way to apply a pattern to the third visit but not the other two visits? I tried using styleattrs datafillpaterns =(E E X1) ; but it does not like E.
Hopefully, that can be addressed in a future release. In the meantime, you can work around the issue by specifying the fill patterns in a little inherited style. Here is a simple example:
proc template;
define style styles.mystyle;
parent=styles.journal2;
class graphdata1 /
fillpattern = "E";
class graphdata2 /
fillpattern = "x1";
end;
run;
ods html style=mystyle;
ods graphics / attrpriority=none;
proc sgplot data=sashelp.class;
vbar age / response=weight group=sex groupdisplay=cluster
nofill fillpattern;
run;
ods html close;