ODS Graphics procedures primarily strive towards the following goal: "Make simple graphs easy and complex graphs possible". SGPLOT procedure allows you create simple graphs with a single plot statement, and create complex graphs by layering together or combining multiple plot statements. Generally, the appearance follows the guidelines set by industry thought leaders like Tufte or Robbins of minimal ink and avoidance of "chart junk".
However, one persons chart junk is another persons "cool" feature. The default behavior of the procedures conforms to the above mentioned principles. However, a few options are available to change the graph appearance. These include the DATASKIN and the FILLTYPE options. In this article, I will address a change in the FILLTYPE behavior.
The FILLTYPE option was first released with SAS 9.4, and implemented as an alpha gradient. Bars and histogram bins could have a gradient color appearance, which was created by a linear variation of the opacity of the bar color as we go from top of bar to bottom. So, the fill color showed at the top of the bar, and the wall color showed through at the bottom. Often since the wall color was white, the bar appeared to have a gradient color from the fill color to white (or whatever the wall color was set to).
proc sgplot data=sashelp.cars noborder; vbar type / response=mpg_city stat=mean filltype=gradient baselineattrs=(thickness=0); yaxis display=(noline); xaxis display=(nolabel noline noticks); run; |
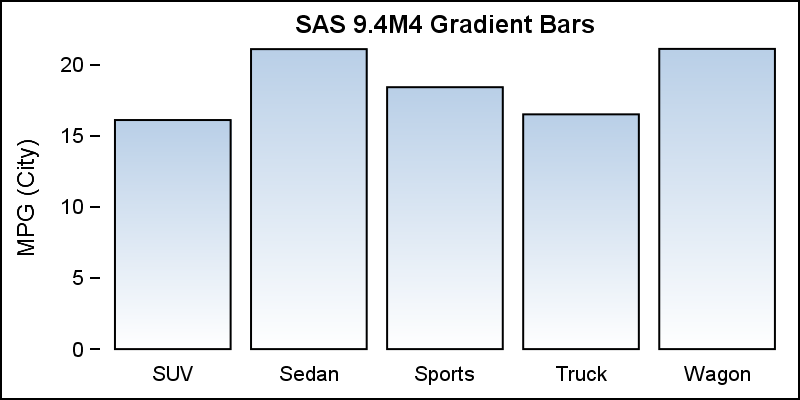
Note, the use of FILLTYPE=Gradient in the code. The bars have the appearance of a color gradient from the default bar fill color to white (the wall color). Now, let us add y-axis grid lines to the graph as shown below.

From the above graph, the use of opacity gradient is evident from the way the grid lines show through the bars. This behavior was not desirable, and extra work was needed to avoid the grid lines from showing through.
With SAS 9.40M5, the FILLTYPE option now has three settings: SOLID | GRADIENT | ALPHAGRADIENT. The default is still SOLID. GRADIENT now means "color gradient", which goes from the fill color at the top to the wall color at the bottom. However, it is fully opaque (actually uses the set transparency value, which is zero by default). Now the grid lines or other plots behind the bars will not show through.
Here is the code for SAS 9.40M5, and the resulting graph.
proc sgplot data=sashelp.cars noborder; vbar type / response=mpg_city stat=mean filltype=gradient displaybaseline=auto; yaxis grid display=(noticks noline); xaxis display=(nolabel noline noticks); run; |
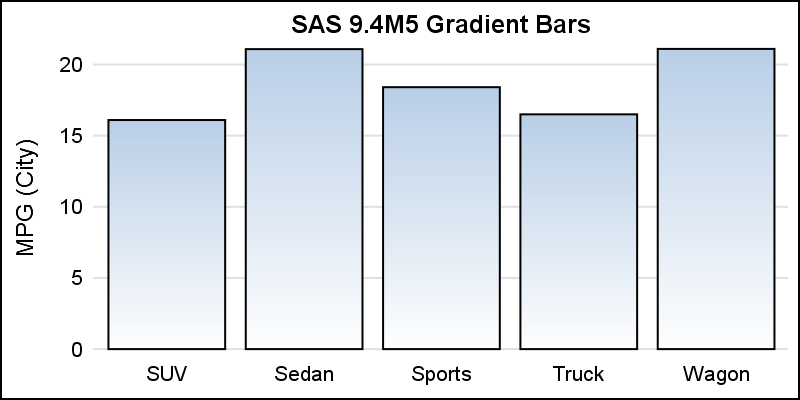
Note, the grid lines do not show through the bars. Also note the use of DISPLAYBASELINE=AUTO, another SAS 9.40M5 feature, which prevents the display of the baseline when the baseline intercept is at the end of the y-axis. Now, no additional tricks are needed to get the nice gradient color bars.
So, from SAS 9.40M5 onwards, FILLTYPE=GRADIENT works as a color gradient. If you really need the previous behavior, you can still get it by using FILLTYPE=ALPHAGRADIENT.
One benefit of this change is the ability to set the end color using the FILLENDCOLOR=color option. Now, the bar gradient is actually from the fill color to the fill end color, which by default is the same as the wall color. However, you can FILLATTRS=GRAPHDATA2 and set the FILLENDCOLOR=yellow to get the graph shown below.
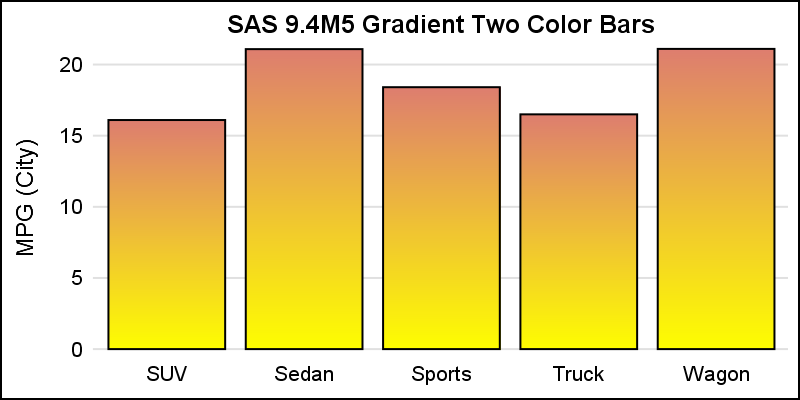
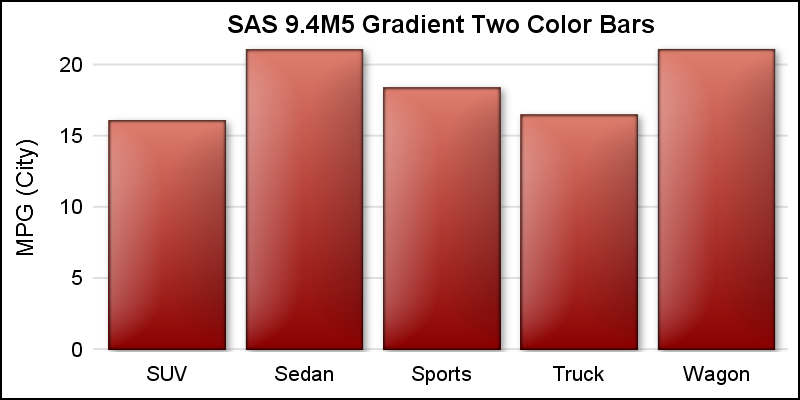
Now, I admit I used a rather high contrast end color to demonstrate the gradient effect. Mostly, we see the use of a slightly darker color setting for the end color with a skin as shown below (with a MATTE skin)
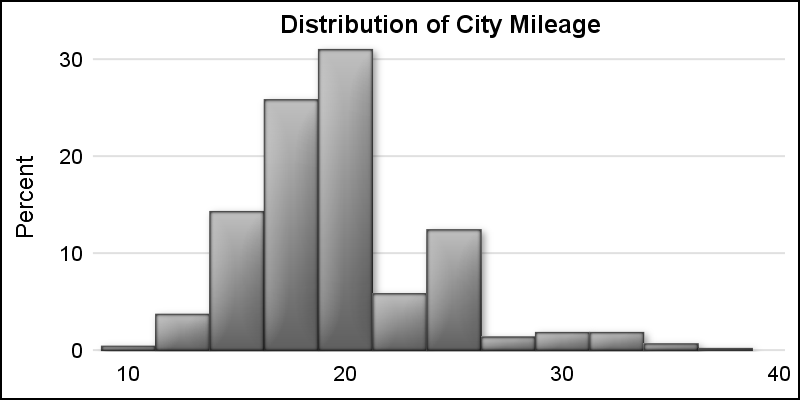
Gradient fill also works for Histograms.
Full SAS 9.40M5 code: GradientColor
