Once in a while you run into a pesky situation that is hard to overcome without resorting to major surgery. Such a situation occurs when you have a stacked bar chart with a discrete legend positioned vertically on the side of the graph. A simple example is shown below.
title 'Product Sales by Country';
proc sgplot data=sashelp.prdsale noborder;
vbar country / response=actual group=product displaybaseline=auto
seglabel datalabel dataskin=gloss filltype=gradient nooutline;
yaxis display=(noline noticks nolabel) grid;
xaxis display=(noline noticks nolabel) offsetmax=0.3;
keylegend / location=inside position=topright across=1 fillheight=10 fillaspect=2 opaque;
run;
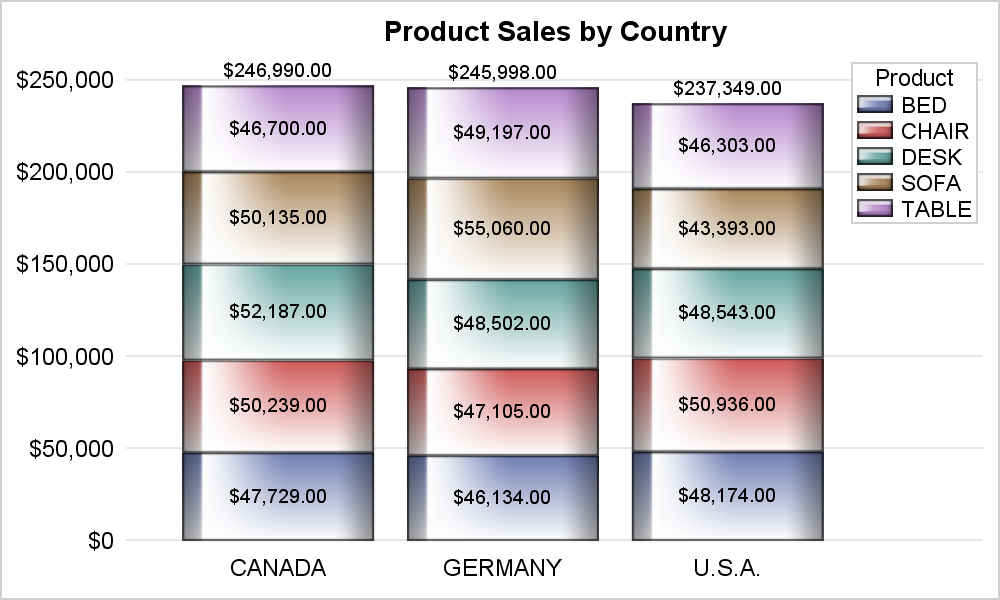
The key legend is displayed on the right side. I have created a bit of a space for it by setting OFFSETMAX=0.3 on the x-axis. Note, the group values in the legend are in the reverse stacking order from the bar itself. This happens because the bars are stacked from bottom to top, while the display of the legend is created from top to bottom.
One might think, no biggie. I'll just reverse the group order for the bar chart. Setting GROUPORDER=REVERSEDATA results in the graph shown below.
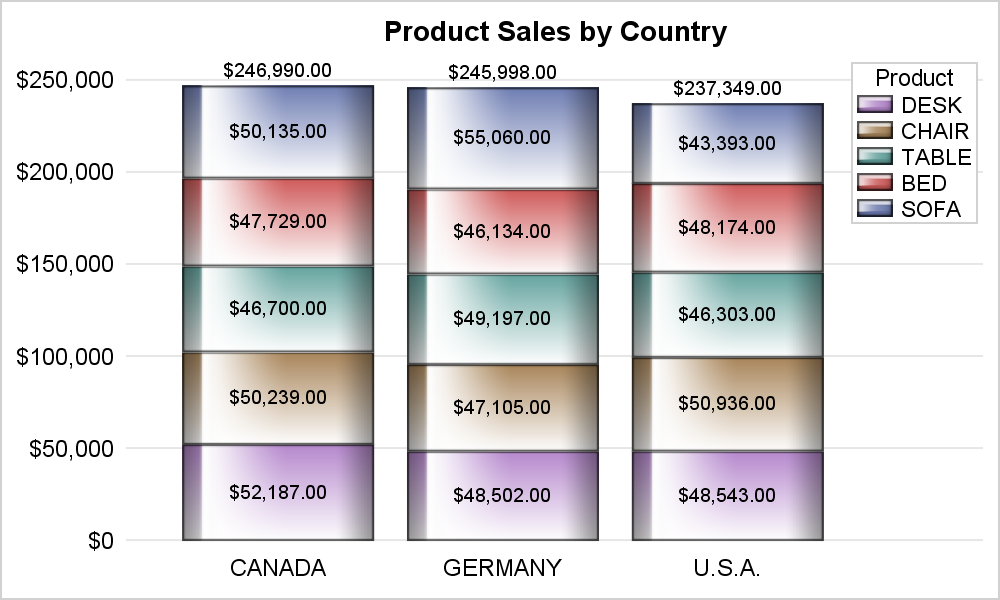
Now the stacking order of the groups in the bars is indeed reversed, but so is the order in the legend. So, we are still out of sync. The SORTORDER option on the KEYLEGEND supports ASCENDING and DESCENDING, but not reverse. How do we get the order in the legend and the bar to be in the same (top down) order?
One way to achieve this result is to use the Discrete Attributes Map as discussed in this previous article. You can define the map with the values in the order you want, and set the option to display all entries from the attr map. This causes all entries to be displayed (regardless whether they exist in the data), and in the order you want. While this is useful, and gets the job done, it is specific to the values in the data. So, if the data changes, you have to define the map again for the data. So you see what I mean by "major surgery" needed to fix this pesky little problem.
Well, finally we have a simple solution with SAS 9.4M5. The KEYLEGEND statement now supports the SORTORDER=REVERSEAUTO value on the right side of the "=". Using this option places the legend values in the order reverse of the automatic behavior. Note, the order of the entries for each statement name are reversed, not the full combined list. The code and resulting graph is shown below. Full code is linked at the bottom.
title 'Product Sales by Country';
proc sgplot data=sashelp.prdsale noborder;
vbar country / response=actual group=product displaybaseline=auto
seglabel datalabel dataskin=gloss filltype=gradient nooutline;
yaxis display=(noline noticks nolabel) grid;
xaxis display=(noline noticks nolabel) offsetmax=0.3;
keylegend / location=inside position=topright across=1 opaque
fillheight=10 fillaspect=2 sortorder=reverseauto;
run;
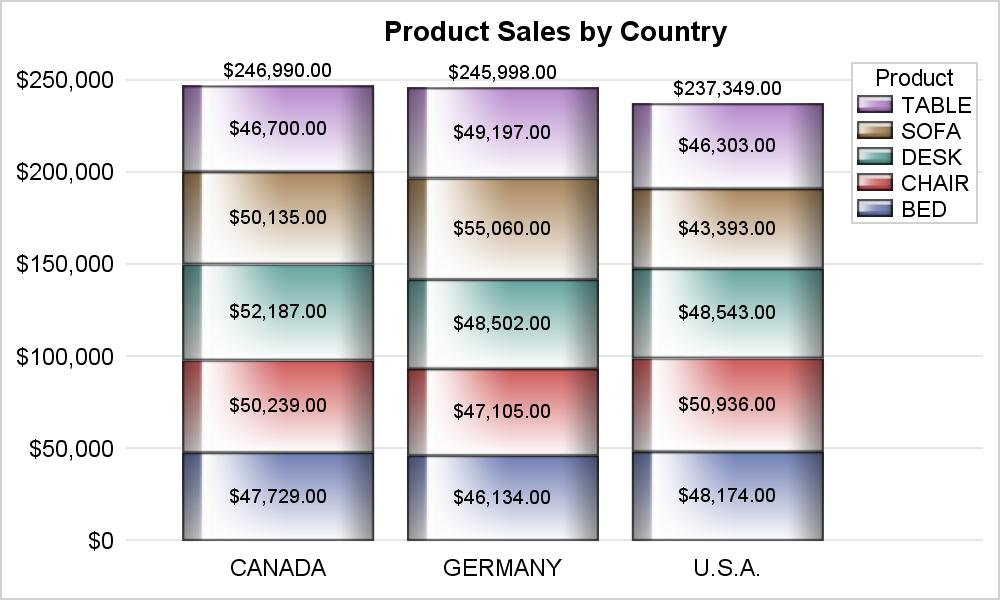
Now, the order of the groups in the bars and in the legend are in the same top down order. This is also useful if you have a HBAR with a legend that is arranged horizontally.
Note also the use of a relatively new option SEGLABEL to display the summarized value for each segment of the bar. BARLABEL option is also used to display the total summarized value at the top. Also note the options FILLHEIGHT and FILLASPECT to increase the size of the entries in the legend.
Full SAS 9.40M5 SGPLOT code: Legend_Reverse


