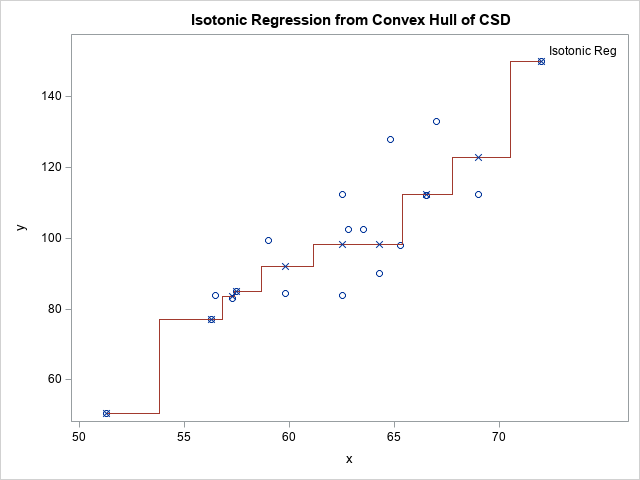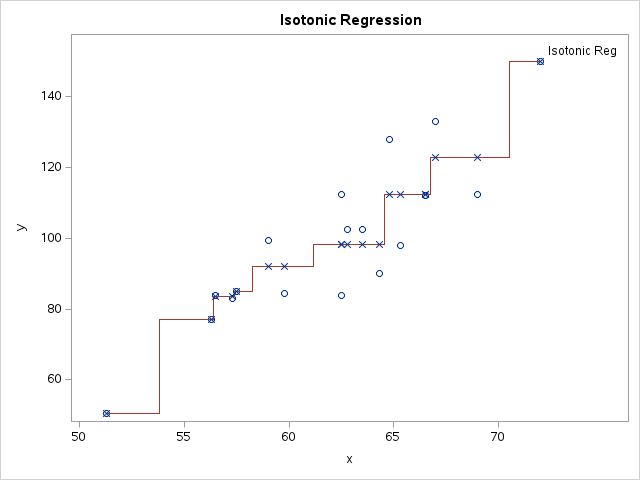
A previous article shows that you can run a simple (one-variable) isotonic regression by using a quadratic programming (QP) formulation. While I was reading a book about computational geometry, I learned that there is a connection between isotonic regression and the convex hull of a certain set of points. Whaaaaat?


