There is one equation every retail store, call center, traffic, airport or hospital manager should know by heart. No, it’s not E = mc². The one I had in mind is this:
W = 1 / (μ – λ)
It may not look like much, but it can mean the difference between happy and exasperated customers, satisfied and frustrated citizens, or even life and death. This is the equation that describes the average total time (W) your customers spend in your system, and depending on the other two parameters, the results can be quite shocking.
 λ is your average customer arrival rate. This could be customers walking through the door, incoming help desk calls, or patients arriving by ambulance. We’ll use four per hour, or one every 15 minutes, for our example below.
μ is your average processing rate. Again, this could be checking out at the cashier, airport take-offs and landings, technical support problem resolution or medical procedures. For the example below, we’ll use five per hour, or one every 12 minutes.
Given those parameters – customers arriving roughly every 15 minutes, but being able to process each one in just 12 minutes – you wouldn't initially think that wait time would be a problem – you’ve got this covered, right? Wrong.
Let’s do the math.
Total average time in the system:
W = 1/(5-4) = 1/1 = 1 hour.
Wait? What? An hour? Is that right? How can that be?
The reason stems from that little word “average,” the average arrival and processing rates. Customers, calls, cars and patients don’t arrive in perfectly timed increments as if on an assembly line. They arrive randomly, sometimes in clusters and sometimes with large gaps between individuals and clusters. And your staff doesn’t always process each customer at a constant rate as if they were robots – some take just a minute or two while others require extensive attention. It’s that inherent variability that makes the difference.
And it gets worse the closer you get to capacity – not just worse-worse, but geometrically worse. Imagine that the arrival rate increases by, say, 20 percent. What do you think happens to the average wait time? If you thought it might get longer by roughly that same 20 percent, you’d be off the mark by an order of magnitude.
Let’s do the math again. The arrival rate increases from four per hour to 4.8 per hour (a 20 percent increase) while the capacity remains at five per hour. W now equals 1/(5-4.8) = 1/0.2 = 5 hours! A 400 percent increase over the first case. Although you’re technically still processing at a faster rate than your customers are arriving, for all intents and purposes, it doesn’t matter; your customers are hanging up, walking away or dying.
If you want to see the more entertaining version of this attribute of the wait time equation, watch: I Love Lucy, season 2, episode 1, “Job Switching,” more commonly remembered as ‘Lucy and the Candy Factory.’
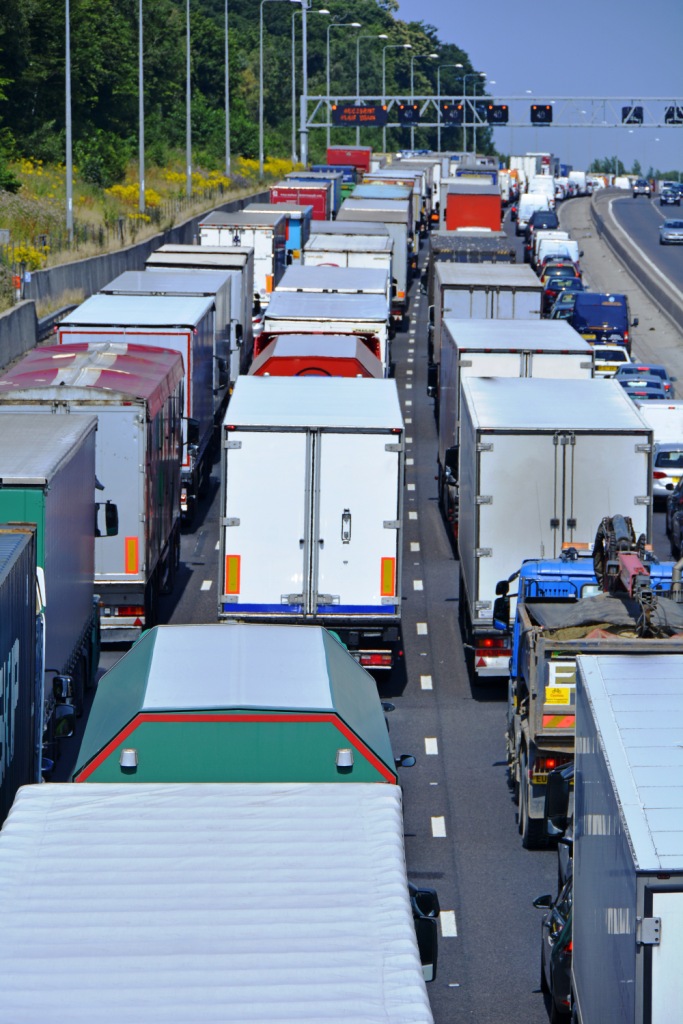
It’s this non-linearity that accounts for traffic jams during rush hour, an hour on the tarmac at LaGuardia waiting to take off, and long lines during the Christmas shopping season. You can have the best people in the world working for you, but that won’t compensate for the system variability.
So what can you do? There are a number of approaches to dealing with such randomness. One obvious approach would be scheduling, which at least reduces the randomness on the arrival rate component. Another is to limit the length of the queue – callers get a busy signal instead of elevator music while on hold. A third option is to prioritize, like a hospital does with triage. Pooling is another good alternative, where everyone is placed into a single queue and is assigned to the first available cashier or tech support.
And of course you can add resources. The math isn’t exact in this case, but the above formula provides a workable approximation, especially if pooling is involved as well (i.e. people can switch from the longer/slower moving line to the shorter/faster one).
Let’s look at two more examples to assess the impact. Using our example from above and adding a second cashier/processor, λ would go from four per hour to two per hour, resulting in (approximately) W = 1/(5-2) = 1/3 = 0.33 of an hour, or ~ 20 minutes, versus 60 minutes with just the lone cashier. A third person lowers the time still further to about 16 minutes, perhaps not worth the cost, but under certain circumstances might be the right decision to make.
[Halving the arrival rate is like slotting half of the total arrivals to each cashier – not an exact calculation but this approximation will suffice for the typical store manager. Note that it would be improper to halve the processing time/double the capacity, as one person still takes an average of 12 minutes to process an order no matter how many cashiers there are.]
To implement this approach you need to know the values of the two parameters. μ is the easier one to obtain since you should already have some basic understanding of how long it takes to process a call or a customer.
Knowing your λ requires some method of tracking new arrivals, be that a sensor at the door, or administration at the check-in desk. Then it requires some means of communicating that value to the manager – perhaps a digital display at the front end or back office, or an app on their mobile device, the advantage of the latter being the ability to also input the μ value and let it calculate W for you, and even alert the manager when it exceeds a certain threshold.
The most important takeaway, however, is simply the numeracy and situational awareness required to make productive use of the wait time equation. Even if your manager can’t readily perform the calculation, simply having an understanding of the problem, and knowing that it’s not only NOT going to fix itself, but will get exponentially worse as the load on the system increases, should allow them to recognize when things are close to getting out of control and take appropriate measures. Don’t wait to make that “All cashiers to the front” call until the line is halfway back to the loading dock – just get one more staff member in place while the line is still manageable and you'll prevent the delays and frustration before they get started.
Interested in learning more about analytics and optimization? Check out SAS Optimization.