Stratified bootstrapping and when to use it

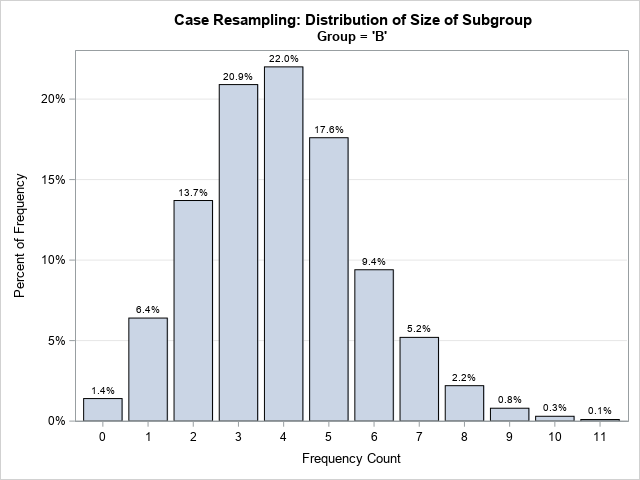
When you use the bootstrap method in statistics, the most common resampling method is called case resampling. For data that has N observations, each bootstrap sample is created by sampling with replacement from the N observations (or "cases") in the data. However, if the data set includes categorical variables, it