Overlay multiple custom density curves on a histogram in SAS

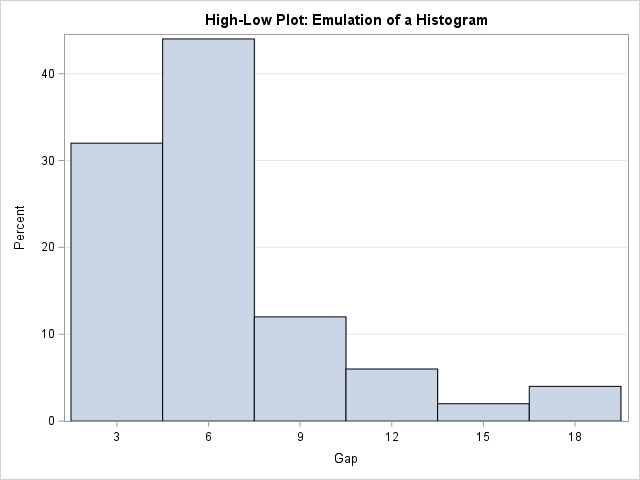
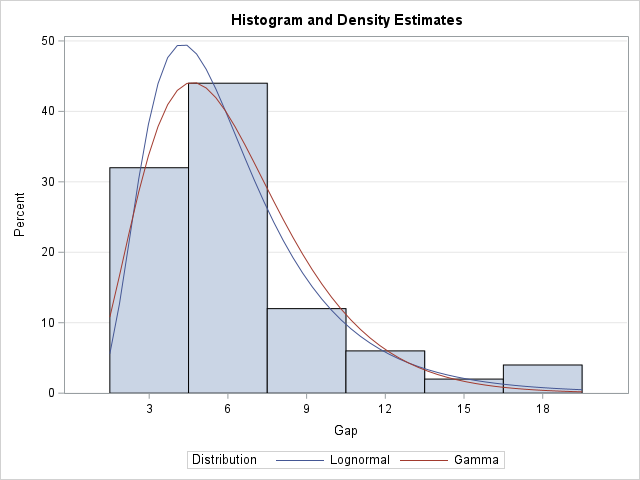
A previous article discusses various ways to overlay a density curve on a histogram in SAS. SAS provides several procedures that handle this task for common univariate probability distributions such as normal, lognormal, and gamma. If you define and use a less common distribution, you can write a GTL template