Most SAS programmers know how to use PROC APPEND or the SET statement in DATA step to unconditionally append new observations to an existing data set. However, sometimes you need to scan the data to determine whether or not to append observations. In this situation, many SAS programmers choose one of the following methods:
- Inside a DATA step, use the SYMPUT call to create a macro variable that indicates whether to append observations. After the DATA step ends, use %IF-%THEN processing to check the value of the macro variable and conditionally append the observations.
- Use the DATA step to determine whether to append data and append data in the same DATA step. This is especially useful if the values for the new observations depend on the data that you scanned.
This article shows the second method. It shows how to use the SAS DATA step to scan through observations and remember certain values. If a condition is met, it uses the values to append new observations to the end of the data by using end-of-file processing.
A motivating example
Often SAS programmers need to implement complicated data-dependent logic. A simple example is "If the XYZ variable contains a certain value but doesn't contain a different value, then do something." On the SAS discussion forums, the experts often suggest scanning through the data with a DATA step and keeping one or more "flag variables" that indicate which conditions have been satisfied. At the end of the DATA step, you can look at the values of the flag variables to determine what action to take.
Last week I encountered a situation where I needed to conditionally append observations to input data. Although the solution is easy if you use the SAS/IML language (which enables you to scan an entire vector of values), I needed to solve the problem by using the DATA step, which processes only one observation at a time. The problem had the following form:
- The data are in long form. The character variable TYPE always contains the values 'Min' and 'Max'. The numeric variable VALUE contains numbers.
- The TYPE variable might or might not contain the values 'LowVal' and 'HighVal'. If they do appear, they always appear after the 'Min' and 'Max' values.
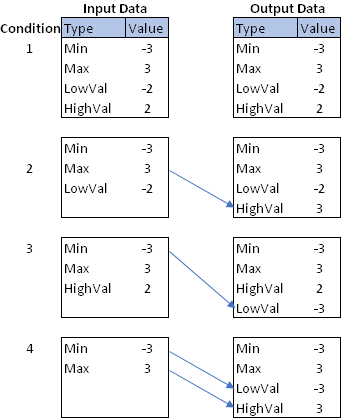
The goal is to create an output data set that always contains the four values 'Min', 'Max', 'LowVal', and 'HighVal'. The goal is summarized by the figure to the right. The following list describes how to generate the 'LowVal' and 'HighVal' observations if they do not exist.
- If TYPE='HighVal' does not appear in the data, create it and copy the value of the TYPE='Max' observation to use for the VALUE variable.
- Similarly, if TYPE='LowVal' does not appear in the data, create it. Copy the value of the TYPE='Min' observation to use for the VALUE variable.
The figure shows the four situations that can occur. The input data set always contains the 'Min' and 'Max' values but can contain none, one, or two of the other values. To goal is to produce the data set on the right, which always contains all four values. The next section presents a solution, so stop reading here if you want to solve the problem on your own!
The END= option and end-of-file processing
To solve the problems, I used two facts about the SAS DATA step:
- You can use the END= option on the SET statement to create a temporary binary indicator variable that has the value 1 for only the last observation of the input data.
- The SAS DATA step contains an implicit loop over all observations in the input data. If you do not use an OUTPUT statement, the DATA step performs an implicit output for each observation. However, if the program contains an OUTPUT statement anywhere in the program, then the implicit output is disabled. Therefore, whenever you use an OUTPUT statement, you must use other OUTPUT statements whenever you want to write an observation to the output data set.
The following program scans the input data. It remembers the values of the 'Min' and 'Max' observations, in case it needs them. It uses indicator variables to determine whether the data contains the 'LowVal' and 'HighVal' observations. After the input data are read, the program uses an end-of-file indicator variable (EOF) to determine whether or not to add observations for 'LowVal' and 'HighVal'.
Because the program uses an OUTPUT statement to (conditionally) create new observation, you must also put an OUTPUT statement after the SET statement to ensure that the original observations are all written.
/* Include all 4 test cases. Use WHERE clause to test each case. */ data Test; length Type $7; input Group Type $ Value; datalines; 1 Min -3 1 Max 3 1 LowVal -2 1 HighVal 2 2 Min -3 2 Max 3 2 HighVal 2 3 Min -3 3 Max 3 3 LowVal -2 4 Min -3 4 Max 3 ; /* Input order is always 'Min' and 'Max' optionally followed by 'LowVal' and 'HighVal', if they exist. */ %let dsname = Test(where=(Group=4)); /* use 1,2,3,4 to test all cases */ data Want; drop HighFound LowFound Min Max; /* temporary variables */ retain HighFound LowFound 0 /* binary indicator variables: Initialize to 0 (false) */ Min Max .; /* VALUE of 'Min' and 'Max' obs: Initialize to missing */ set &dsname end=EOF; /* EOF is temporary indicator variable */ output; /* need OUTPUT because of EOF processing */ if Type = 'Min' then min = Value; /* remember the Min value */ else if Type = 'Max' then max = Value; /* remember the Max value */ else if Type = 'LowVal' then LowFound = 1; /* Low value found; no need to create it */ else if Type = 'HighVal' then HighFound = 1; /* High value found; no need to create it */ /* end-of-file processing: conditionally append new observations */ if EOF then do; if ^LowFound then do; /* Low value not found. Add it. */ Type = "LowVal"; Value = Min; output; end; if ^HighFound then do; /* High value not found. Add it. */ Type = "HighVal"; Value = Max; output; end; end; run; proc print data=Want; var Group Type Value; run; |
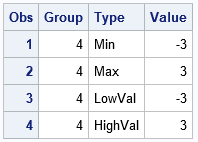
The result is shown for input data that contains only the 'Min' and 'Max' observations but not the 'LowVal' or 'HighVal' observations. The output shows that the 'LowVal' or 'HighVal' observations were correctly appended to the input data, and that values for the VALUE column were copied from the 'Min' and 'Max' observations, respectively. You can verify that the other three input data sets are also correctly handled.
Use caution with the DELETE and subsetting IF statements
When performing end-of-file processing, be careful if you use a DELETE statement or a subsetting IF statement. For details and examples, see "The Perils of End-of-File Processing when Subsetting Data" (Landry, 2009). Landry summarizes the problem as follows (p. 2): "The problem occurs only when the last record in the dataset is deleted.... The reason this happens is that when a record is deleted..., SAS stops processing and returns to the next iteration of the DATA step. Thus, any executable statements placed after the [DELETE or subsetting IF statements] do not get executed."
Summary
In summary, this article shows how to use the SAS DATA step to conditionally add observations to the end of the input data. This is useful for data-dependent logic when the observations that you need to append depend on the values of the data. You can perform end-of-file processing by using the END= option on the SET statement to create an indicator variable that has the value 1 for the last observation in the input data. You can use the OUTPUT statement to append additional observations, but remember that you also need to use the OUTPUT statement after the SET statement if you want to output the original data.Do you have a favorite way to conditionally append data? Do you know of other potential pitfalls with end-of-file processing? Leave a comment.

9 Comments
Pingback: Annotate features of a schematic box plot in SGPLOT - The DO Loop
Hi Rick,
The data setup you described sounds like a perfect one for dynamic data structure (a.k.a. hash table)
The following code handles all groups in one data step:
data Want2;
array types[-1:4] $ 7 _temporary_ ('' '' 'Min' 'Max' 'LowVal' 'HighVal') ; /* defined types */
if _N_ = 1 then /* set up hash table */
do;
if 0 then set Test;
declare hash H();
H.DefineKey('Type');
H.defineData('Value');
H.defineDone();
end;
H.clear();
/* for each group upload hash */
do until(last.Group=1);
set Test end = EOF;
by Group;
_IORC_ = H.add();
end;
/* in case of missing data extend the output */
do _N_ = 1 to 4;
Type = types[_N_];
Value = .;
_IORC_ = H.find();
if Value = . then _IORC_ = H.find(key:types[_N_-2]);
output;
end;
if EOF then stop;
keep Group Type Value;
run;
ods html;
proc print data=Want2;
var Group Type Value;
run;
All the best
Bart
Thanks for the program. I told a colleague last week that I expected a reader to write in with a hash tables solution. I'm glad that you did not disappoint me!
As you might expect, this is a simplified presentation of a more complicated scenario. In case you are interested, the actual application of this technique (that is, why I needed it) in discussed in the article "Annotate features of a schematic box plot in SGPLOT". To goal of that article is to modify the output from PROC BOXPLOT in the case where the data set has no outliers or has only high outliers (or only low outliers). For example, the following data do not contain any low outliers, so the output from PROC BOXPLOT does not contain all the observations I need to annotate a box plot.
Rick,
SQL can do that if table was not big.
data Test;
length Type $7;
input Group Type $ Value;
datalines;
1 Min -3
1 Max 3
1 LowVal -2
1 HighVal 2
2 Min -3
2 Max 3
2 HighVal 2
3 Min -3
3 Max 3
3 LowVal -2
4 Min -3
4 Max 3
;
proc sql;
create table want as
select a.*,case when missing(b.value) then
case when a.type='LowVal' then
(select value from test where group=a.group and type='Min')
when a.type='HighVal' then
(select value from test where group=a.group and type='Max')
else .
end
else b.value
end as value
from (
select * from
(select distinct group from test),
(select distinct type from test)
) as a left join test as b
on a.group=b.group and a.type=b.type;
quit;
Thanks for posting an SQL solution.
Two comments:
Your statement "if the program contains an OUTPUT statement anywhere in the program, then the implicit output is disabled." is potentially misleading for programs with more than one DATA step. If some DATA steps contain OUTPUT statements and others do not, the implicit output is only disabled for the DATA steps that contain the output statements.
A DATA step can do all of your cases at once with a BY statement (in this case "by group;"). Just initialize on first.group (instead of on the RETAIN statement) and create the necessary observations on the last.group observation instead of on the EOF observation.
Thanks for writing. To clarify, I meant "if the [DATA step] contains an OUTPUT statement anywhere in the [DATA step], ..."
For readers who might be unfamiliar with By-group processing in the DATA step, see the article "How to use FIRST.variable and LAST.variable in a BY-group analysis in SAS".
This is a perfect case for using DOW loop and by-group processing. Process all of the scenarios in one pass. My solution closely resembles yours, but I wouldn't bother with indicators. Just capture the high and low values if they exist, then use the coalesce() function to use the min/max values if the low/high values are missing.
data want;
lowval = .;
hival = .;
do until (last.group);
set Test;
by group;
select (Type);
when ('Min') do;
min = value;
output;
end;
when ('Max') do;
max = value;
output;
end;
when ('LowVal') lowval = value;
when ('HighVal') hival = value;
end;
end;
Type = 'LowVal';
value = coalesce(lowval, min);
output;
Type = 'HighVal';
value = coalesce(hival, max);
output;
run;
Great post