Every presidential candidate has a list of states they’re expected to win, but there are always states that are too close to call because they have similar numbers of registered voters for each of the two dominant political parties: Democrat and Republican. It’s in these “swing” states that candidates invest
Tag: election
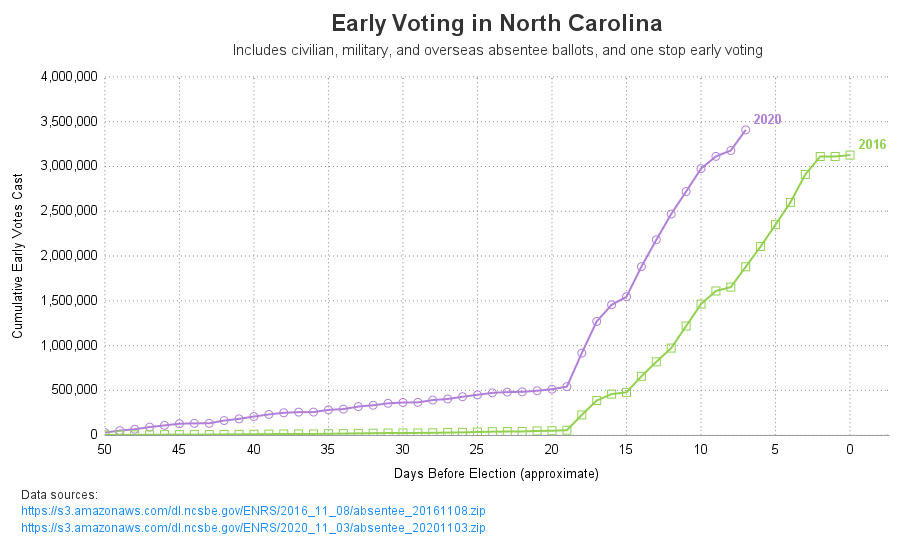
Here in the United States, we have our general election (where we elect the president) every four years - and 2020 happens to be one of those election years. This time we seem to have a lot more people voting early. I can't tell you the reason they're voting early
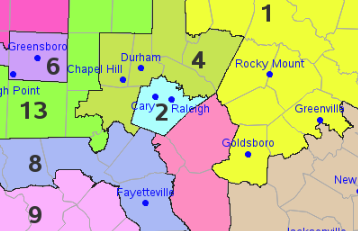
North Carolina recently re-drew the congressional district boundaries for the upcoming 2020 election. Here's a copy of the new map, from the ncleg.gov website: A couple of years ago, I created an enhanced version of the 2016/18 map, and I thought I'd do the same for the new 2020 map...
North Carolina is one of those key "swing states" that might possibly decide a national presidential election. And with such an election coming up next year (2020), I thought I would have a look at the voter registration data to see how it has changed since the previous presidential election
Yesterday we had a 'special election' here in NC, to elect new members to the House of Representatives for Congressional Districts 3 and 9. The election got a lot of national news coverage, therefore I thought people might like seeing the results plotted on a map. Before I decided to
Certain North Carolina counties have been in the news lately, for suspected election fraud involving absentee ballots in the 2018 election. Let's analyze the voter registration and absentee ballot data, to see if we can detect anything suspicious! In order to definitively determine whether fraud & illegal activity occurred, investigators
There has been a lot of controversy surrounding this year's midterm election, when it comes to counting the ballots ... and I kept hearing the term provisional ballots in the news. But I'm embarrassed to say that I didn't really know much about provisional ballots. I decided to do a
The US 'midterm' elections have finally started to wind down, and we finally have some (mostly) finalized results to study. But what's the best way to visualize who won the US congressional seats in each of the 435 districts? Let's dive into this topic!... Preparation For starters, I couldn't find
With the recent midterm elections here in the US, I frequently saw congressional district maps popping up in the news. And being a GraphGuy, I wanted to fully understand these maps, to see if I might could improve them. If you're interested in congressional district maps, follow along as I
With today being an election day here in the US, I see a lot of people wearing the 'I Voted' sticker. This got me wondering if I could create my own sticker ... using SAS software and simple graphics primitives. :-) So I started by using Proc Gslide to create
Elections are in the news again, therefore I have been on the lookout for interesting graphs. I recently found some graphs of the Census Current Population Survey (CPS) Voting and Registration Supplement data, and tried to improve them. Follow along if you're interested in voter data, or creating better graphs!
In FiveThirtyEight's Significant Digits section, they recently mentioned that nine states could potentially have 50% or more females in their legislature after the upcoming election. My first thought - I need to see some graphs! They linked to a New York Times article that had some interesting graphs. There was
Why do people donate money to politicians and political parties? Sometimes it's because they agree with the platform, but sometimes it might be for potential financial benefits. When it comes to large donations from Fortune 500 companies, I suspect the latter! And since politics has been in the news a
Unless you live under a rock, you've probably seen news reports that Russian trolls have been posting on social media to allegedly conduct "what they called information warfare against the United States, with the stated goal of spreading distrust toward the candidates and the political system in general," according to
Can felons vote? This seemed like a simple question, but I realized that I wasn't 100% sure of the answer. Therefore I looked into the data ... and apparently "it depends". Follow along and see how I created a map to help answer this question. But before we take the
The first time I voted (back in the 1980s), I was very surprised that I didn't have to show any kind of identification. I assumed it was because I lived in a small North Carolina town of 300 people where "everybody knew everybody" ... but they told me that nobody
Are your friends passing around clever memes (supposedly) featuring something your favorite actor said, or sharing news articles that you think might be "fake news"? If there's even a hint of data analyst in you, then you probably check the actual data, and confirm or disprove the supposed facts yourself. I
After the recent presidential election, I was updating my graphs of the voter registration data and noticed that the number of registered voters decreased after the election. At first I thought that was odd, but then I realized that maybe inactive voters were being purged. I wanted to find out
On any inauguration day in our country’s history people probably found themselves in one of three categories: happy & hopeful, disappointed & apprehensive, or apathetic & checked-out. Change is difficult, whether you perceive it as positive or negative. This blog is not to share which category I fall into but
Parents are always proud of their kids, and think their kids are better than all the other kids. I guess it might be a little bit that way with mapping software ... but I really do think I've got a pretty compelling example to show that SAS maps are better
In the US presidential election, each of the 50 states has a certain number of electoral votes, based on the population. Typically, most states cast all their electoral votes for the candidate who wins in their state (all or nothing). But states can split their electoral votes if they want
Elections in the US are a 'target rich environment' for data analysts. There are surveys and forecasts before the election, and the presentation of results during and after the voting. What's your favorite election-related graph of all time? For the current (2016) presidential election, my favorite graphs are on the
In the past, a large percentage of US workers have been union members, and the unions could exert a big influence on elections. How powerful are the unions these days, an where do they wield the most influence? Let's map it out... In 1954, almost 35% of US workers belonged to
Since this is an election year, I've been scrutinizing the voter registration data. One thing that surprised me is there are more female voters registered in NC than males. I wondered if this was consistent across all 100 counties, and created some charts to help visualize the data... First I went
How is it that 91% of the US didn't vote for either Hillary or Trump in the primary, but yet they're still the final two candidates in the presidential election? Let's break it down with a simple graph! I recently saw a really cool slideshow on the nytimes website, that answered
In recent years, more and more people have been registering as independent voters in the US, rather than Democrat or Republican - the independents now control well over 1/3 of the votes. Will they likely vote for the Democrat or Republican candidates in the upcoming election? Let's break down some numbers
With a major election coming next year, I was wondering if there have been any shifts & changes in the voters in my state. This seems like an interesting opportunity for some data analysis, eh!?! To get you into the spirit of elections, here's an "I Voted" sticker from my friend
I'm ramping up my visualization skills in preparation for the next big election, and I invite you to do the same! Let's start by plotting some county-level election data on a map... To get you into the spirit of elections, here's a picture of my friend Sara's dad, when he was
In the U.S. we have a presidential election every 4 years - and as luck would have it, 2012 is an election year! I see a lot of election maps & graphs in the news, and I'm always subconsciously critiquing them in my mind and thinking to myself, "How would I graph this