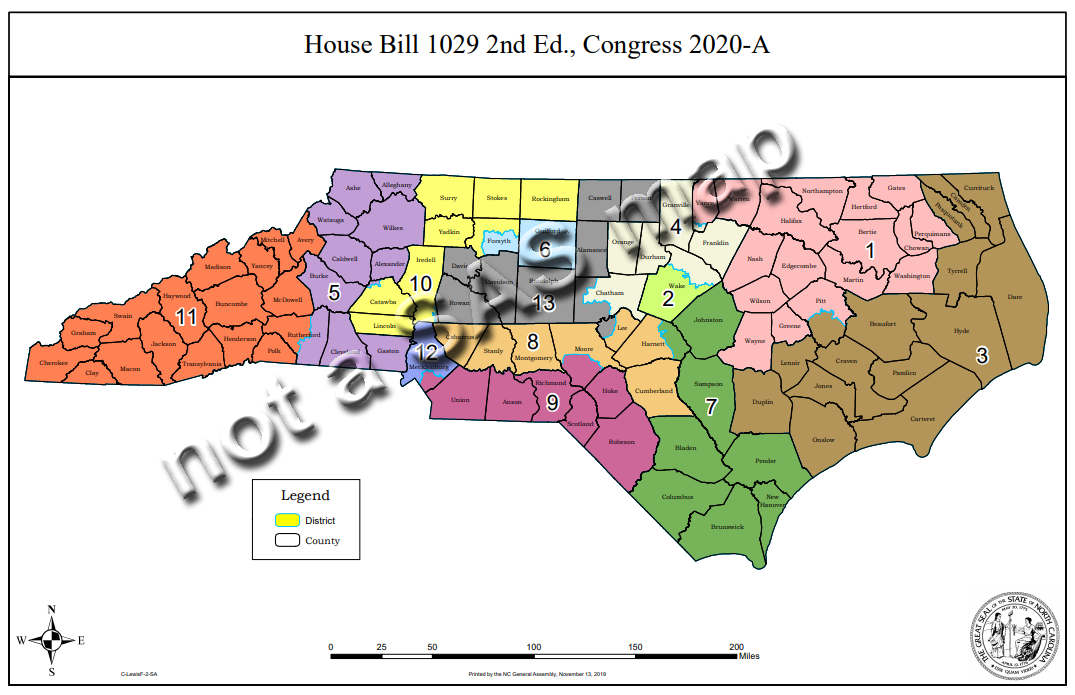
North Carolina recently re-drew the congressional district boundaries for the upcoming 2020 election. Here's a copy of the new map, from the ncleg.gov website:
A couple of years ago, I created an enhanced version of the 2016/18 map, and I thought I'd do the same for the new 2020 map...
Map Polygon Data
I enlisted the help of my friend Rich to find the shapefile for the latest map. You go to the page for the House Bill 1029, click on "Show all Associated Documents," and then "Shapefile" is one of the available documents. 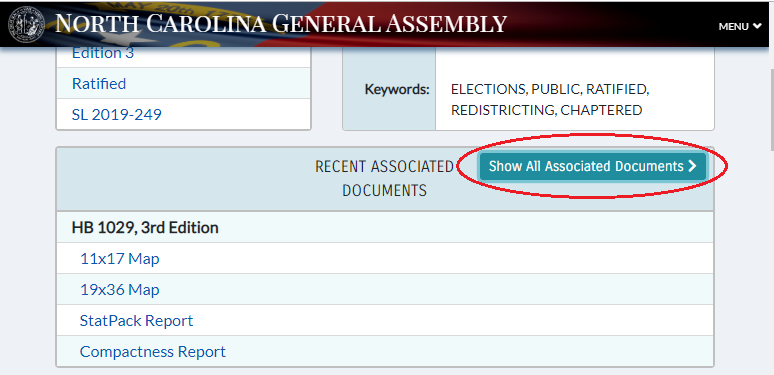
I downloaded the zip, and extracted the shapefile's files:
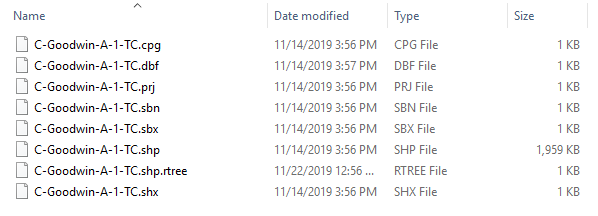
I then imported the shapefile into SAS using the following code. Now I'm ready to create my custom map ...
proc mapimport
datafile="nc_congressional_districts_2020_shapefile/C-Goodwin-A-1-TC.shp"
out=raw_data;
run;
My Improvements
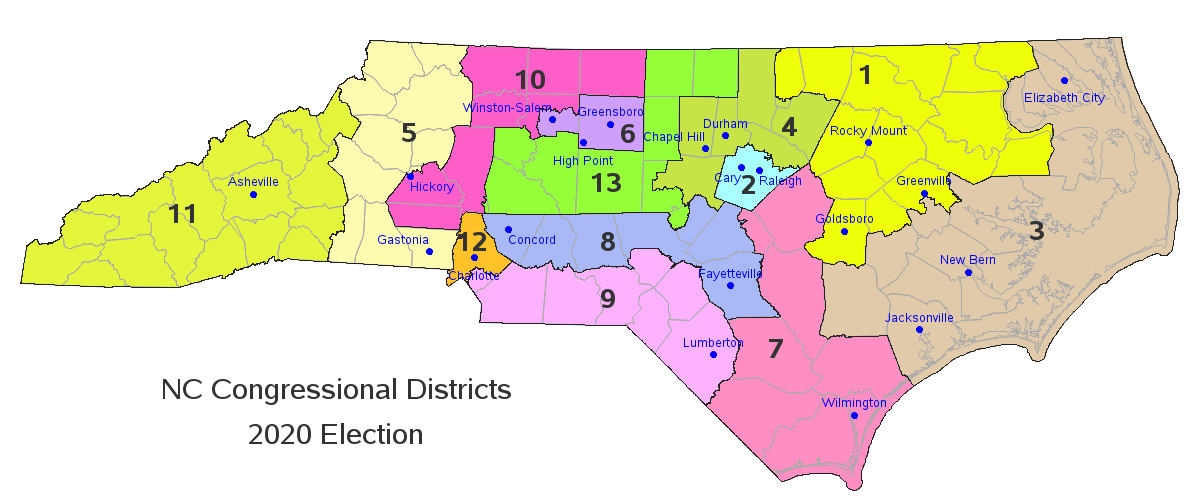
In the original map (above), the main visual focus was on counties (county outlines are drawn, and each county is labeled), and the congressional districts are colored (but that seems to be of secondary visual importance). In my map, I wanted to make the congressional districts the main focus, and the counties secondary.
Also, I think most people only recognize the name of the county they live in - they probably don't know the other 99 counties. But people do recognize the names of the larger cities - therefore I label the cities, rather than counties, because I think they make better reference points.
And I changed the colors, making them brighter, so the lines and text will be higher-contrast. (And the colors also match my 2018 map, for easy comparison).
Here's my new version of the map (click the image below to see the full-size map, and click here to see the SAS code used to create it):
Comparing to 2018 Map
If you'd like to compare the new 2020 map to the 2018 map, I recommend viewing each one in a separate browser tab, and then switch between the two tabs. This will help you visually identify the areas that are 'different'.
Discussion
How do you like the way I've presented the congressional district map? Are there enhancements or changes that you would recommend? Feel free to discuss in the comments section, below!
As the redistricting process itself is quite a polarized topic, please discuss that elsewhere! (not in the comments below). Please limit the discussions here, to just be about the graphical presentation of the data. 🙂


2 Comments
Thanks for the info! As a NC resident, and having already written maps for the current Congressional Districts, it's nice to know where the new district shape files are.
Happy to be able to share the info! 🙂