There has been a lot of controversy surrounding this year's midterm election, when it comes to counting the ballots ... and I kept hearing the term provisional ballots in the news. But I'm embarrassed to say that I didn't really know much about provisional ballots. I decided to do a bit of research on the topic, and thought I'd share some of the interesting things I found.
A provisional ballot "is used to record a vote when there are questions about a given voter's eligibility that must be resolved before the vote can count." When one of the candidates is winning by a landslide, the provisional ballots aren't that important - but when two candidates are in a very close race, the provisional ballots might decide who wins.
Data
I did a bit of searching, and found that a list of all the provisional ballots for the North Carolina midterm election is available for download. Go to the https://www.ncsbe.gov/index.html website, click download data, click ENRS, click the desired election date 2018_11_06, and then select the provisional_20181106.txt file. I saved the file to disk, and imported it into SAS so I could do some graphical analyses (here's my code, in case you'd like to play around with it).
Simple Chart
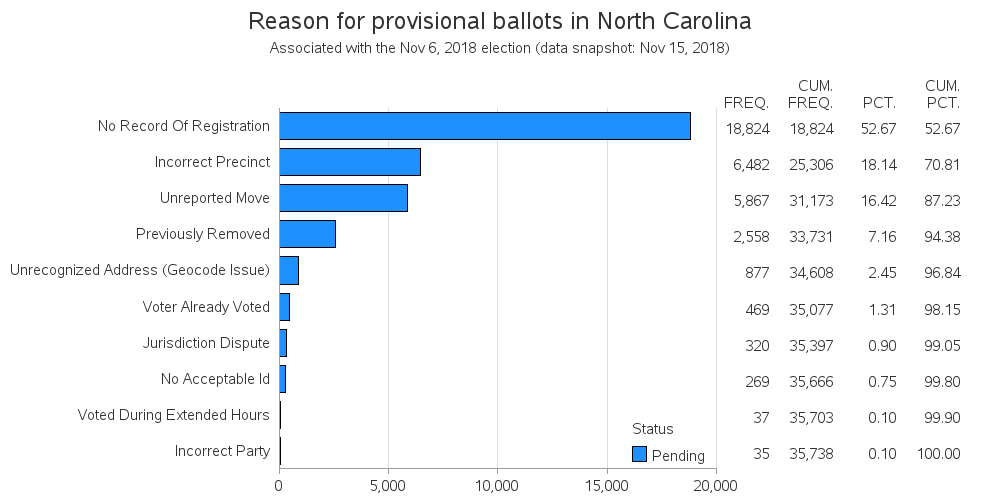
I started with a simple bar chart, where each bar represents a reason for the provisional ballot. The bars are sorted so you can easily see the most common reasons for provisional ballots, and the summary table beside the chart allows you to quickly see that 35,738 provisional ballots have been turned in (so far).
Typical Maps
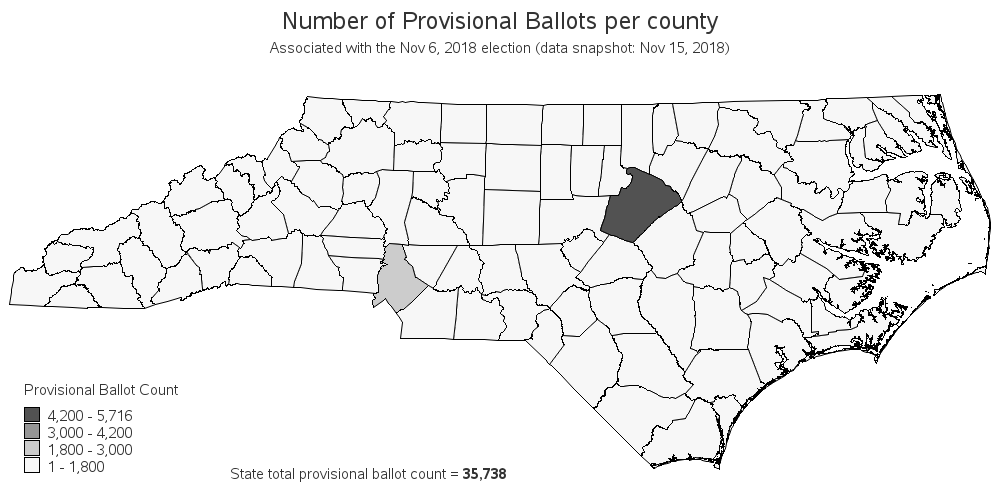
Since the data shows the county for each provisional ballot, I thought it might be interesting to plot it on a map. Here's my first attempt - it shows that the counties containing Raleigh and Charlotte have many more provisional ballots than the other counties. But, of course, that's no surprise, since those two counties have much higher populations than the other counties.
While the above map is a true representation of the data, it's not really that informative. The color bins (or shades of gray) in the legend are created using a simple algorithm (basically taking the min & max values, and then creating 4 evenly-spaced color bins between those numbers). A different approach is to use quantile binning (or, as in this case with 4 legend color bins, quartile binning) - in quartile binning, the ranges for each legend color bin are chosen such that approximately 1/4 of the counties are in each color bin. Quartile binning makes it easy to see which counties are in the top quarter, bottom quarter, etc ... but it's not all that useful with this particular data (and perhaps even harmful). Here's the same data plotted with quartile binning:
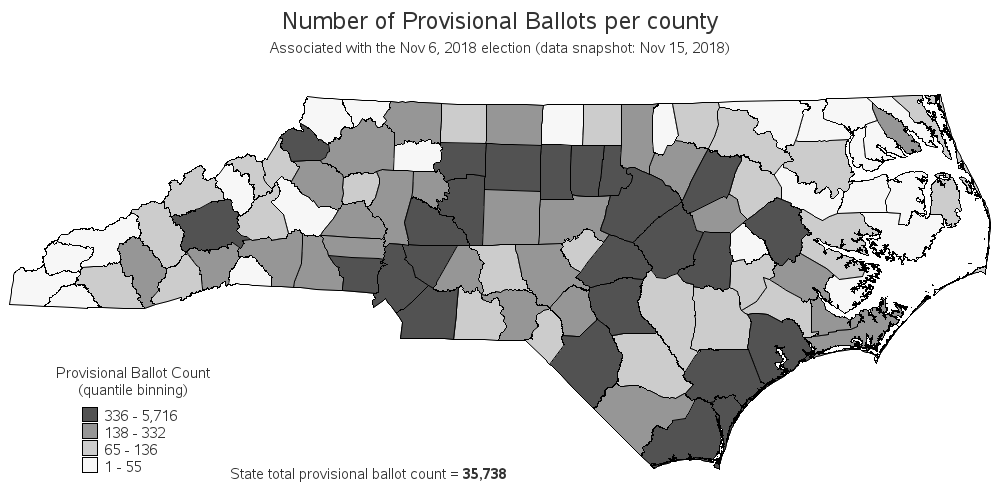
Both of the above maps show that counties with higher populations (and therefore a higher number of registered voters) tend to have more provisional ballots ... which just isn't that insightful or useful. :-(
A More Interesting Map
You know what would be more interesting? - to know the number of provisional ballots per 1000 registered voters! Therefore I downloaded the voter registration county summaries from another ncsbe page, and imported them into SAS. I then used Proc SQL to combine the provisional ballot data with the number of registered voters data, and calculated the number of provisional ballots per 1000 registered voters ... provisional_per_1000 = provisional_ballot_count / (registered_voters/1000). Now we've got something to plot that we can actually compare from county-to-county, without the population differences being the main factor!
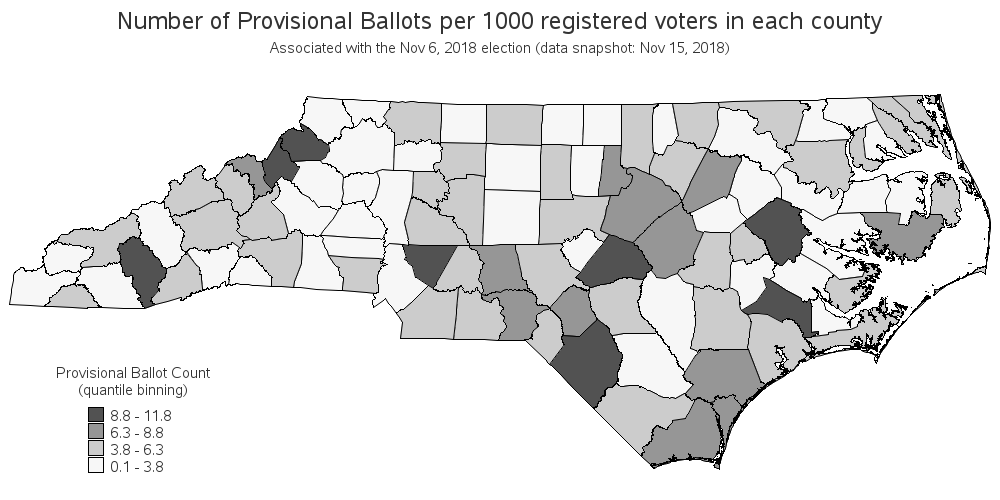
Hopefully you know a little more about "where do provisional ballots come from" now -- both in terms of what voter problems produce them, and what counties they are most prevalent in. Have you ever had to use a provisional ballot, and if so what was the reason, and did it get resolved?
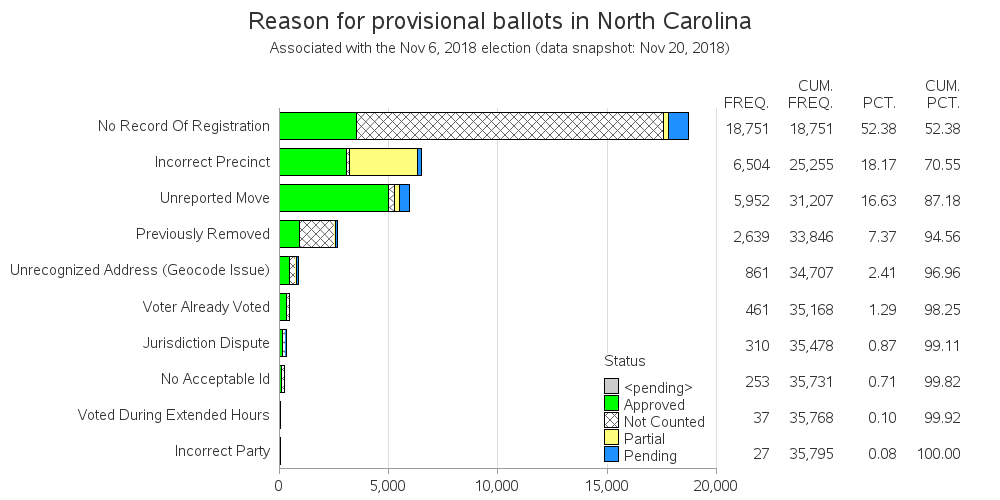
November 26 Update!
Now that most of the provisional ballots have been resolved, here is an updated bar chart, colored by status. Looks like when there's no record of registration, the provisional ballots usually don't get approved.