Here in the United States, we have our general election (where we elect the president) every four years - and 2020 happens to be one of those election years. This time we seem to have a lot more people voting early. I can't tell you the reason they're voting early (perhaps because of covid-19? perhaps because of this year's political climate?) ... but I can show you a graph of the numbers!
I downloaded the raw data (showing each individual voter who voted early in NC), extracted the zip file, imported the csv into SAS, used SQL to summarize the data, and then a data step to calculate the cumulative totals. I then plotted both the 2016 and 2020 cumulative totals on the same graph, with the x-axis showing the number of days before the election (aligning the two lines on the day early in-person voting started).
And here's the graph:
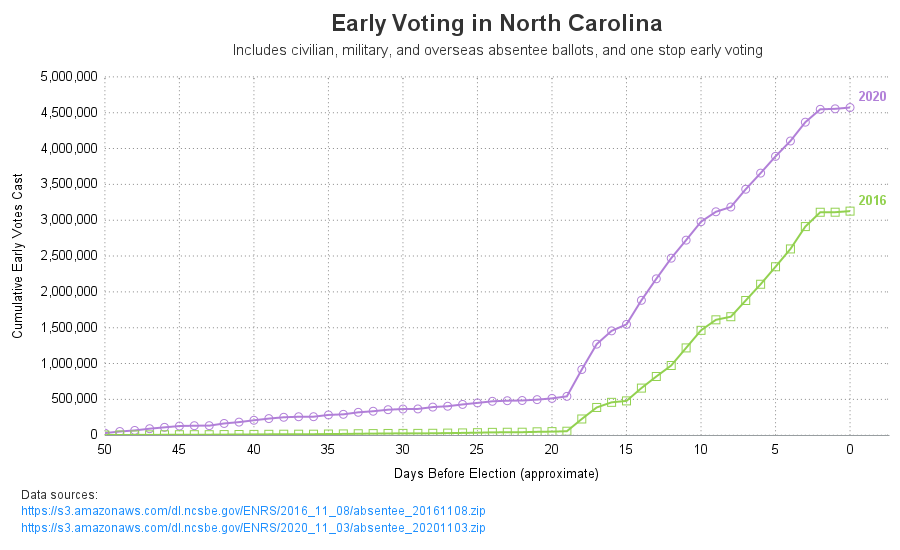
And the big question - Will the 2020 numbers stay this far ahead of the 2016 numbers? Or will the two curves eventually converge? Feel free to leave a comment with your thoughts on that! (be sure to keep the comments civil, with no "partisan politics"!) 🙂
Coding Details
For those of you who are data-meisters (and in particular SAS programmers), below are some technical details about the code I used to create the graph. And here's a link to the SAS code, and the HTML version of the output (with the live links to the data in the footnotes).
- I got the data from the NC State Board of Elections - here are links to the 2016 and 2020 data.
- Once I downloaded the zip, and extracted the csv, I used Proc Import with dbms=csv to read the data into SAS.
- I used Proc SQL's count() function to calculate the number of votes for each day, and a data step to calculate the cumulative number of votes.
- Proc SGplot allowed me to overlay the two lines.
- I used annotated text for the footnotes(so I could embed links to the data sources in the HTML output.
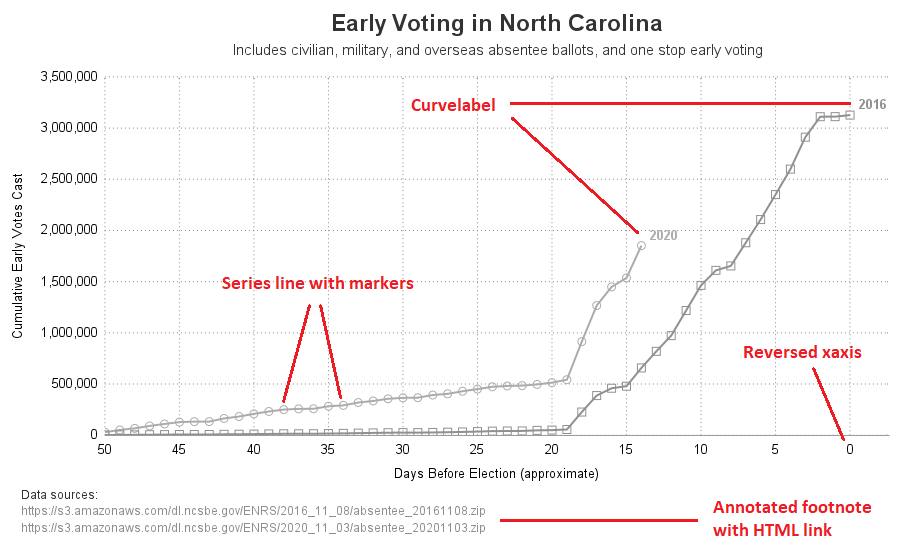
- I used series plots for the lines, and the 'markers' option to add markers at each data point along the line. I think the markers give a good visual cue as to how fast the data is increasing (the farther apart, the faster the increase).
- Rather than using a legend, I use the 'curvelabel' option to label each line with the year.
- And I use the 'reverse' option on the xaxis, so the minimum "days before election" is on the right side of the graph.
Here's a graph, labeled to show where some of the things I mentioned above appear on the graph:


9 Comments
I definitely think the numbers for 2020 will stay ahead of 2016. I know people that have never voted before who are voting in this election. So different too with so many absentee ballots and early voting. Thanks for your graphs!
Thanks Suzanne! - from what I've heard in my small circles, I think you're right!
Please update the graph sometime in November so that we can see the final outcome. Thanks for your post!
That's what I'm planning to do! 🙂
Actually, if you can find the time, another update or two before the election would be of interest.
Regardless, once again, a great graphical display of data/information.
Thanks Don! - I'll try to make several updates along the way "The good Lord willing, and the creek don't rise!" 🙂
It is great that you provide SAS code with your data sources. I would like to use your program applied to my own area, the DMV, that's the Washington, D.C. with Maryland and Northern Virginia.
Sounds like a great idea!
I know people that have never voted before who are voting in this election. So different too with so many absentee ballots and early voting. Thanks for your graphs!