How you flavor your foods can have huge impact on your health. Many of the spices we use to enhance our foods have powerful medicinal benefits like turmeric and ginger. Cinnamon also has amazing benefits and a lot of research behind it.
English
In this blog post, I put some classic rock song data under the SAS Analytics microscope, to see if I could get a better picture of exactly what is considered 'classic rock' these days... Michael Raithel recently pointed me to an interesting article/study about 'classic rock' music, and invited (or is
➤ DISCLOSURE! In June 2018 Google introduced changes to the way it handles its Maps platform. They now require API key in order to embed a map, plus Google Maps "projects" must now be associated with a billing account. Unless these new Google rules are met, Google maps described in
Do you know something about SAS® software that other SAS users would love to learn? Of course you do! Whether you’re a student or a member of the Circle of Excellence, every SAS programming project, every analysis or forecasting model is an opportunity to gain new insights into SAS processing
IT folks love SQL (Standard Query Language). Once you know how to program in SQL, you can work with almost any database because it is a standard. However, SQL is NOT a standard for doing analytics. The SAS programming language pre-dates SQL and even though SAS does SQL, SQL does not
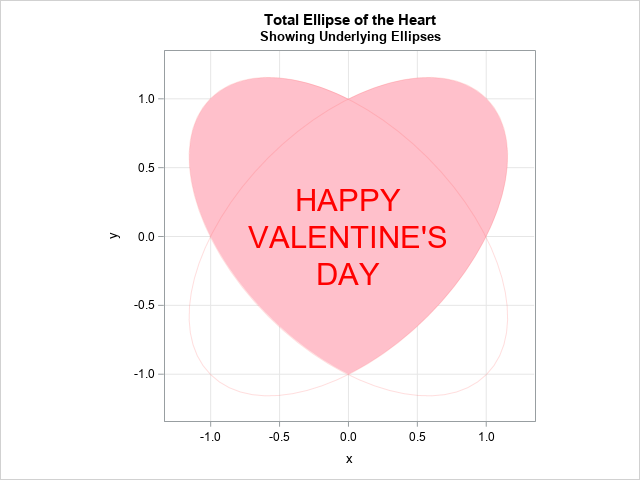
In a previous blog post, I showed how to overlay a prediction ellipse on a scatter plot in SAS by using the ELLIPSE statement in PROC SGPLOT. The ELLIPSE statement draws the ellipse by using a standard technique that assumes the sample is bivariate normal. Today's article describes the technique
The sun has gone eerily quiet, in the middle of what should be the height of the 11-year sunspot cycle... Here's a superb photo of some sunspots that Stephen A. Carr posted to the Telescope Addicts Facebook group - a group which I follow with great interest. (Thanks for allowing
This post could be titled something like "Everything you wanted to know about Group Order in GTL - and more." The group ordering shows up in three different ways in your graph. Assignment of attributes (color, marker symbol) to group values. Position of group values in the graph. Display of the group
Although I’m not particularly excited about football (I admit, I don’t completely understand what offside means), I did follow the last World Cup with more than average attention. Not only for the handsome players, but especially for all the fascinating statistics that appeared. It struck me that heat maps popped
I’ve been told I have rocks for brains before, but right now I have rocks on the brain – the kind that are millions of years old and contain precious stores of oil and gas. One reason I have petroleum on my mind is that I’ve just returned from Brazil, where
Do you know the way to San Jose? By now, SAS users are getting to know the way to the Western Users of SAS Software’s (WUSS) annual event on September 3-5, 2014. Although this is the third time WUSS has been held in San Jose at The Fairmont Hotel, this
It is common in statistical graphics to overlay a prediction ellipse on a scatter plot. This article describes two easy ways to overlay prediction ellipses on a scatter plot by using SAS software. It also describes how to overlay multiple prediction ellipses for subpopulations. What is a prediction ellipse? A
In the summer heat, when The BFD alone isn't quite quenching your thirst for forecasting know-how, here are several other sources: CatchBlog -- by Steve Morlidge of CatchBull From his 2010 book Future Ready (co-authored with Steve Player), to his recent 4-part series in Foresight dealing with the "avoidability" of forecast
SAS is great at helping make important business decisions - how about helping decide where to take your next vacation?... Here's a picture from one of my favorite vacations with my buddy Joe. As you can see, I like "nature vacations." Can you guess where this one was? (leave a comment with
An empty matrix is a matrix that has zero rows and zero columns. At first "empty matrix" sounds like an oxymoron, but when programming in a matrix language such as SAS/IML, empty matrices arise surprisingly often. Sometimes empty matrices occur because of a typographical error in your program. If you
When it comes to e-mail-based newsletters, I'm of two minds. On one hand, I feel like I receive enough (or maybe too much) e-mail and I'm reluctant to clog up my inbox with more stuff -- especially if it's information that's located elsewhere (such as on that big backup drive
Most organizations enjoy a plethora of SAS user types—batch programmers and interactive users, power users and casual—and all variations in between. Each type of SAS user has its own needs and expectations, and it’s important that your SAS Grid Manager environment meets all their needs. One common solution to this
I love summer. I love the sunny days, the sound of the happy birds in the morning, growing tomatoes in my back yard, and playing outside with my family. Beach or mountains – I’m 100% beach. Sunshine or snow? 100% sunshine, palm trees, sand, and the beautiful sound of waves
While managing quality within the four walls of your own operation is all well and good and totally necessary, both the market and your bottom line are demanding a more holistic, quality lifecycle approach, and in support of that aim there is a treasure trove of downstream data waiting to be
Have you written a SAS/IML program that you think is particularly clever? Are you the proud author of SAS/IML functions that extend the functionality of SAS software? You've worked hard to develop, debug, and test your program, so why not share it with others? There is now a location for
Again this year (for the 12th time), SAS Research & Development has funded two $5,000 research grants, to be awarded by the International Institute of Forecasters. Criteria for award of the grant will include likely impact on forecasting methods and business applications. Consideration will be given to new researchers in
This was probably my favorite of the myth-busters webcasts I have been spewing about, and now I definitely want to meet James Dallas so we can discuss and nod emphatically at each other’s insights on this topic! The “You can’t have analytics without IT” myth is the fourth myth covered
A recent project with a supportive housing provider in New York City showed how analytics leads to insights that can change, even save, lives. The New York City Center for Innovation through Data Intelligence (CIDI) is the analytics research arm of the City’s Deputy Mayor for Health and Human Services
In my four years of blogging, the post that has generated the most comments is "How to handle negative values in log transformations." Many people have written to describe data that contain negative values and to ask for advice about how to log-transform the data. Today I describe a transformation
Young digital natives are learning chess at an unprecedented rate. Three-year-olds learn chess from the tablet and quickly become more knowledgeable than their parents. But unlike most tablet games, chess is a gateway to Science, Technology, Engineering and Mathematics (STEM) education. We grown-ups must optimize the chess-to-STEM pipeline, but how? Consider this
Did you inherit code that was written eons ago? Do you find old programs to copy the PROC REPORT code and then simply change the variable names for your new program? Have you wondered what all of those options do? Do you ever send output to the Listing destination (the
Order must be the most frequent cry for help in the SAS classroom. “HELP,” said my student in the classroom. “I work with messy health data. My users want to see data in this order.” T1.col1, t1.col2, t1.col3, t1.col4, t2.col5, t1.col6 and list the remaining columns in column position from
In my previous blog post, I showed how to use log axes on a scatter plot in SAS to better visualize data that range over several orders of magnitude. Because the data contained counts (some of which were zero), I used a custom transformation x → log10(x+1) to visualize the
Data visualization tools are a great way to create impactful reports. A well designed report can give users an understanding of their data quickly and easily. And with tools like SAS® Visual Analytics, users can now quickly visualize and understand vast amounts of data. However, with all the visualization options
SAS users love to look at data. And the data grid in SAS Enterprise Guide is a convenient way to view the contents of a data set. While small data sets can be rendered lickity-split for quick viewing, sometimes people get justifiably anxious when opening very large data. Perhaps they've